M&A Timeline: 5 Essential Checks for an AI Gantt Chart
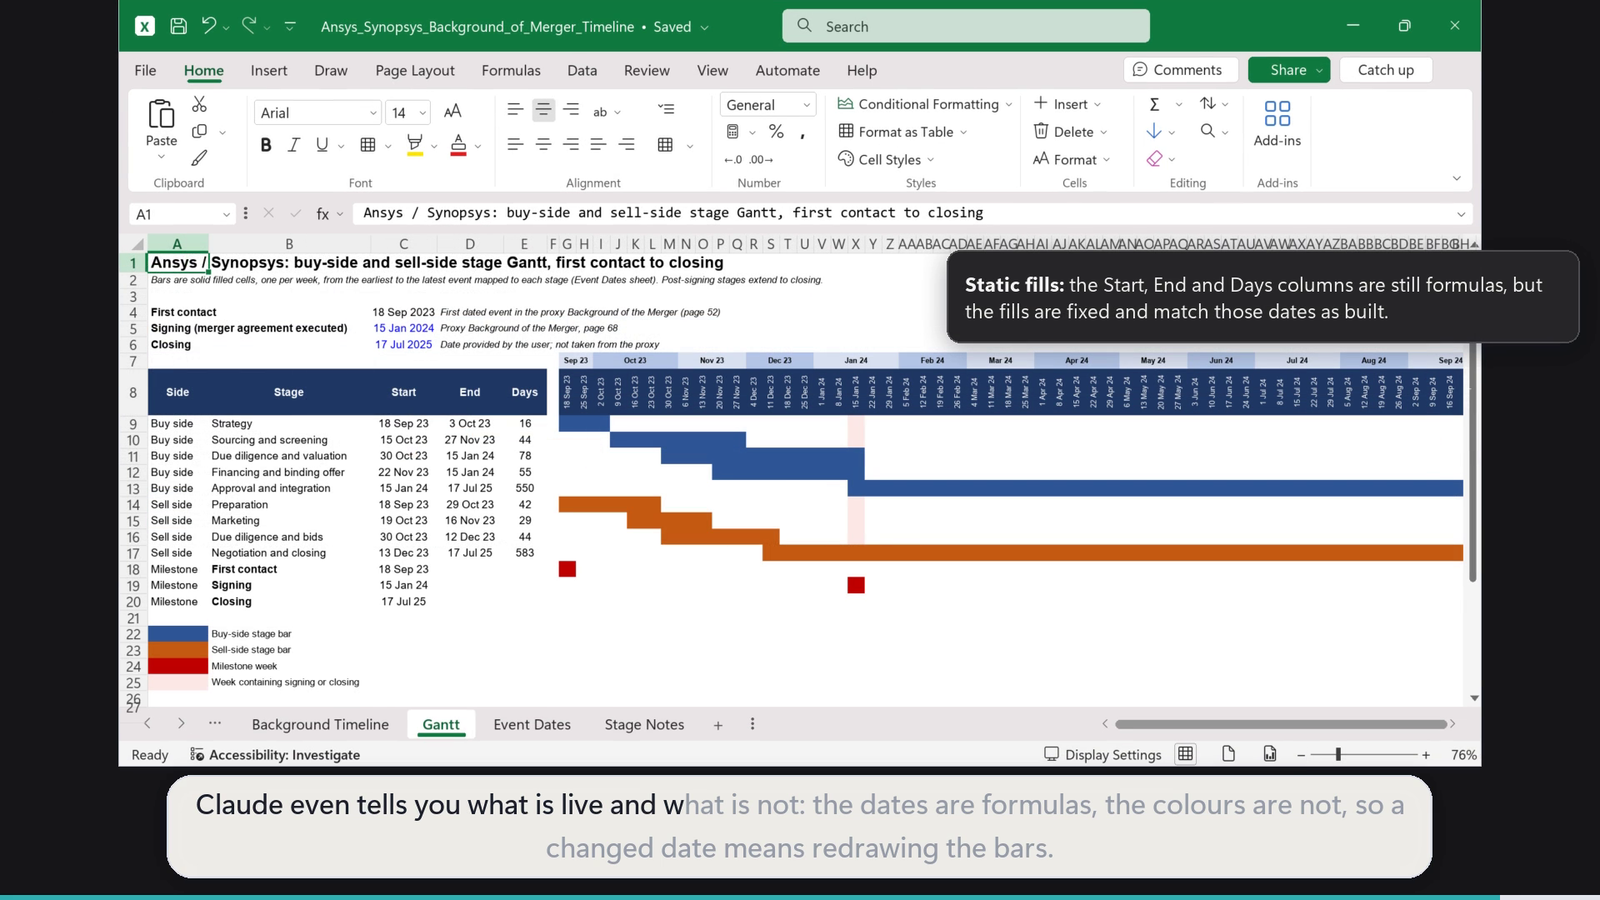
An M&A timeline earns its place in a deal review when each milestone can be traced to a source and the chart stays in step with the dates. In the Synopsys–Ansys case, Claude turned the proxy narrative into an Excel table with 82 event rows, then mapped the process into five buy-side and four sell-side stages. The date cells used formulas. The coloured bars were fixed cell fills. A reviewer who changed a stage date could therefore leave the visual schedule out of date.
Use these five checks to turn a public filing into an M&A timeline you can audit. The exercise covers Ansys’s sale process, including other bidders, from the first dated contact in the table through signing. It adds the eventual closing as a separately sourced milestone.
1. Define where the M&A timeline starts and ends
Choose the deal, the document and the section before asking AI to extract events. This run used Ansys’s definitive proxy statement and prospectus, filed on 17 April 2024, and its “Background of the Merger” section. That section describes a sale process with several bidders. The first row records an approach from the unnamed Party 1 on 18 September 2023. Keep that bidder label when discussing the chart’s starting point.
Separate signing, announcement and closing in the event register. The agreement was executed on 15 January 2024, the transaction was publicly announced the next day, and the acquisition closed on 17 July 2025. The exercise supplies the closing date in the follow-up prompt. The completion Form 8-K independently confirms it.
| Milestone | Date | Source and meaning |
|---|---|---|
| First contact in the workbook | 18 Sep 2023 | Ansys and Party 1, printed proxy p. 52 |
| Agreement signed | 15 Jan 2024 | Synopsys and Ansys executed the agreement, p. 68 |
| Announcement | 16 Jan 2024 | Public announcement, p. 68 |
| Closing | 17 Jul 2025 | Supplied in the exercise, verified against Synopsys’s completion 8-K |
Write those scope choices at the top of the workbook. A buyer’s own process timeline may start at internal strategy approval. This historical M&A timeline starts at the first dated event extracted from the filing. That distinction makes the M&A timeline start date meaningful when someone asks how long the transaction took.
1.1 Label each milestone with a basis
For each milestone in the M&A timeline, record whether the date comes from the historical narrative, a signed document or a later announcement of completion. A board approval and the execution of an agreement can occur on the same day and still be separate actions. Use two rows if both actions matter to the reader. That makes it possible to answer a question about when a party authorised a step as well as when the parties carried it out.
When comparing timetables, define the events that start and end the measurement before calculating a duration. A signing-to-closing comparison can be useful for examining post-signing execution. A first-contact-to-signing comparison addresses a different phase of the sale process. Keep the perspective of the first event visible on any chart that includes multiple bidders.
Watch AI build the event register and Gantt chart
2. Check which document AI actually opened
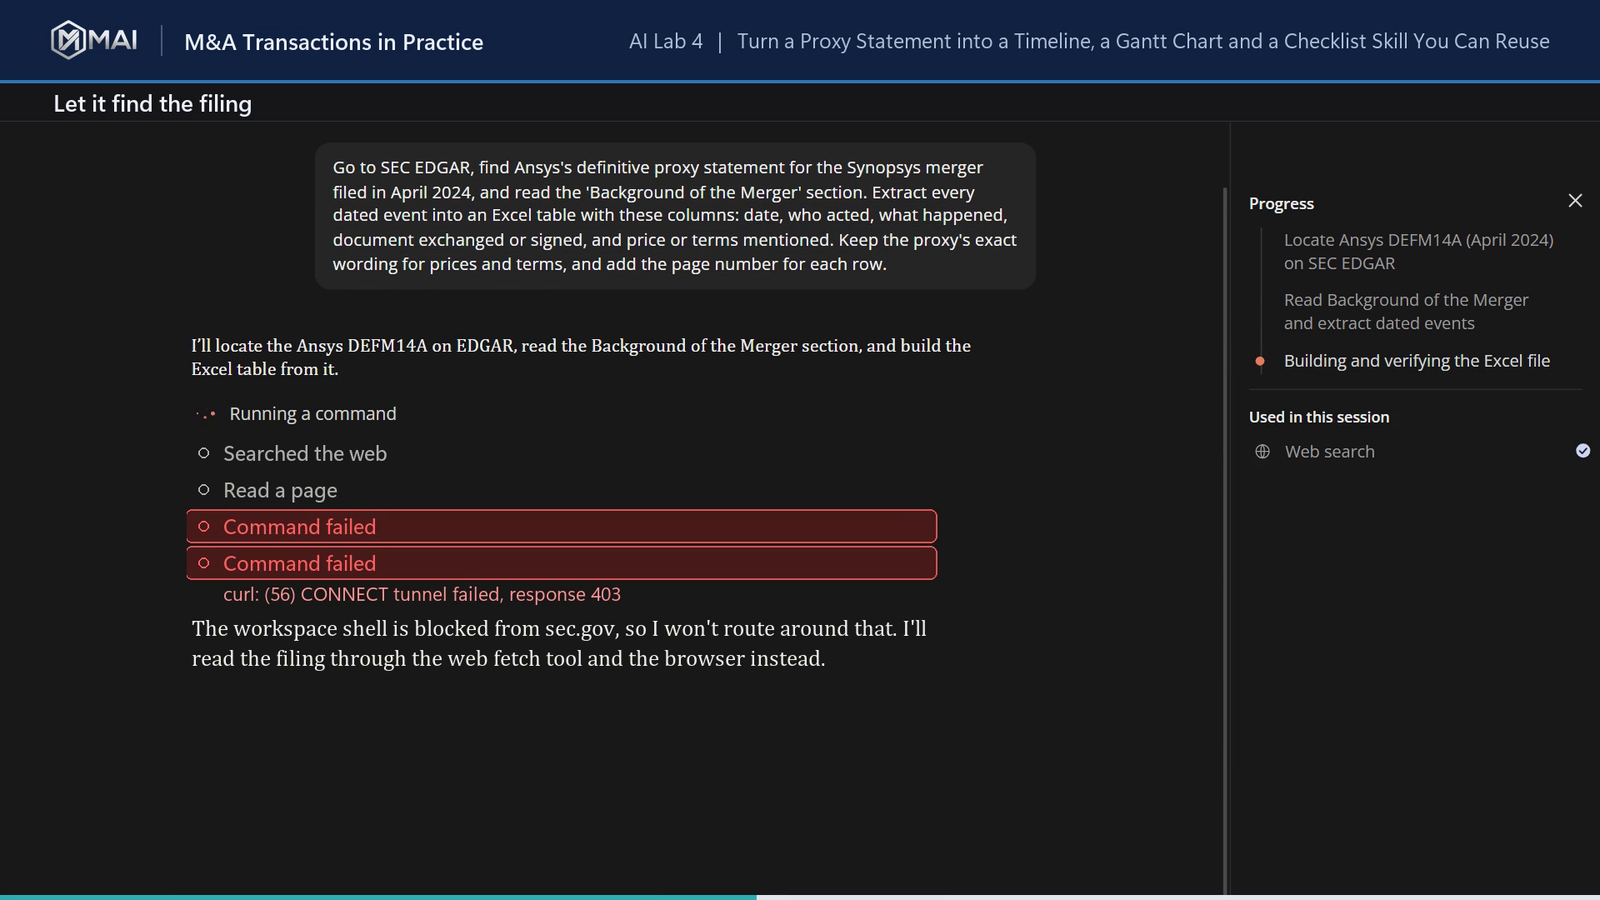
Ask AI to locate the specific SEC filing, open the named section and return one row per event. In the recorded run, the shell route was blocked. Claude then used web retrieval and a browser route and produced the Excel file. That sequence matters because the first failure is evidence about one access route. The completed workbook gives the reviewer something concrete to test against the filing.
2.1 Check the first and last source references
Request date, actor, action, document, price or terms, and the printed proxy page. Open the first cited page and the last cited page. In this case, the table starts on printed page 52 and ends on page 68. Several entries cite page ranges where an event crosses a page break. The PDF viewer’s page counter can differ from the printed proxy number, so keep the numbering system in the column label.

Use the row count as a reconciliation figure for this run. For another filing, compare the requested section with the table and inspect periods with clusters of board meetings, proposal revisions or gaps. A page citation lets a second reviewer find the source, while a coverage check tests whether the extraction missed something.
2.2 Keep a source log next to the event register
Give the workbook a short source log with the filing type, date, section, page convention and retrieval route. For this M&A timeline, the fallback route belongs in that log. A colleague can then repeat the retrieval without mistaking a blocked shell command for evidence that the filing was absent. If a later filing changes the coverage, add it as a new entry and label the events it supports.
Review duplicate dates by action as well as by day. In the Ansys chronology, board decisions, communications and proposals can share a date. Keep separate rows when they represent distinct actions. When an M&A timeline event spans pages, retain the range and note which page contains the quote or decision you need to substantiate.
3. Read quoted terms and summaries differently
An M&A timeline row can contain several kinds of evidence. The price and terms field holds extracted fragments. The actor, action and document columns are AI summaries. Check a quoted fragment against the exact source wording, then read the surrounding paragraph to verify the summary’s context. If one field is marked “None stated,” retain that label until the filing supplies a value.
3.1 Verify the proposed price and its status
The 15 October row summarises an initial proposal from Party 1 and a request for exclusivity. The proxy describes the proposed consideration as approximately $365 per Ansys share. Treat the amount as a proposal from that bidder at that point in the process. Preserve the qualifiers and separate it from terms that appear in the eventual signed agreement. Read the page to check who sent the proposal and who considered it.

3.2 Preserve ranges and estimates
The follow-up workbook’s Event Dates sheet labels 73 rows Exact, five Estimated and four Range. These are workbook classifications. For example, a narrative reference to the days after a board meeting can support a sequence while leaving the precise day open. Keep the original date wording alongside the working start and end dates so a chart can be adjusted after review.
3.3 Retain enough context to review the numbers later
A single source page may contain a proposed per-share amount, the market price on another day and a proposed exclusivity period. The terms field can hold all three. For a board summary, keep them in separate fields with the date, unit and status. A quoted price is easier to review when the reader can see which bidder proposed it, whether it was an estimate and whether the proposal remained non-binding.
For a second pass, ask AI to return the source reference and the exact wording for any changed terms, alongside its plain-language explanation. Compare the result with the existing M&A timeline before replacing a row. If an amended proposal supersedes an earlier one, preserve both in the chronology and mark which version the decision makers considered at the relevant date.
4. Review the buy-side and sell-side assignments
For this M&A timeline, give AI the two stage lists and ask it to label the same event rows. The exercise uses buy-side strategy, sourcing and screening, due diligence and valuation, financing and binding offer, and approval and integration. The sell-side list covers preparation, marketing, due diligence and bids, and negotiation and closing.
The workbook treats buy-side stages from the viewpoint of the bidder or bidders in an event. An internal Ansys board discussion can receive a sell-side stage and a buy-side n/a. Stages can overlap because bidders were moving at different speeds. For a Synopsys-only schedule, filter by bidder and check which events carry over before recomputing the bars.
4.1 Ask why an event belongs in a stage
Pick one event at a stage boundary. A first indication of interest can support a sourcing label. A proposal with committed terms may belong in financing and binding offer. Ask AI to explain the assignment using the cited paragraph and the definition on the Stage Notes sheet. Log a reviewer’s change with its reason so a second analyst can reproduce the mapping.
The bar start and end aggregate the rows that the workbook includes for that stage. Treat the date interval as a summary of mapped events. If the same bidder appears in successive stages, the chart can show timing and overlap, while the underlying event rows retain who did what.
4.2 Check the rows that drive a bar
In the Event Dates sheet, the buy-side label and the sell-side label have separate columns. The Gantt formulas also require the “In Gantt bar” flag to be Y. Filter that sheet for one stage and the inclusion flag. The earliest included start and latest included end are the first values to compare with the Gantt line. The final stage on each side also uses the separately entered closing date.
The buy-side strategy bar runs from 18 September to 3 October 2023 and has an inclusive duration of 16 days. The two endpoints come from the dated events the workbook classifies as strategy. Open the source pages to confirm whose contacts they were, then decide whether they belong in the M&A timeline you intend to share. Changing the scope to one bidder requires reviewing the stage mappings and the included rows.
Explain overlaps with the source events. Sourcing and screening begins before due diligence and valuation, but the workbook assigns events to both stages during part of November. A summary for a deal team can state which streams overlapped and link to the supporting rows. Adding the durations of overlapping bars would double-count days.
5. Test whether the Gantt bars follow a date change
Open the Gantt sheet and find the Start, End and Days formulas. The M&A timeline chart uses static fills for the coloured bars, with no conditional formatting rules to move them. In a copy, change an input that controls a stage end, recalculate, and compare the date cells with the first and last filled cells. A formula change can update the date while leaving the bars in their original positions.
5.1 Reconcile the chart after every change
For a one-off M&A timeline, regenerate the fills and spot-check the endpoints against the formulas. If the workbook will be reused, consider formula-driven conditional formatting, then test changes in each date input and stage mapping. Confirm which milestones come from an explicit source and which dates were supplied by the analyst. That check is especially important for the two bars extended to closing.
5.2 Run a change test in a separate workbook copy
Write down the original closing input in Gantt cell C6, 17 July 2025. The buy-side Approval and integration line and the sell-side Negotiation and closing line both use that input in their End formulas. For a test only, enter 24 July 2025 in the copy. The two end dates should move seven days if the original closing input remains the latest value used by those formulas. The source-linked event rows should stay the same.
For this M&A timeline change test, compare the resulting end dates to the calendar headings above the coloured cells. The Gantt uses weekly columns. A seven-day test makes the visual discrepancy easier to spot than a one-day test that stays in the same column. Inspect the M&A timeline’s closing marker too. The workbook uses fixed styling, so the bar and milestone marker should be reconciled when a date moves. Restore the confirmed date or discard the test copy before sharing the historical M&A timeline.
Use the appropriate day-count convention. The workbook’s buy-side approval line shows 550 days because its Days formula counts the start and end dates. The 549-day interval between signing and closing is elapsed time. Label whichever calculation you use in the chart or memo so reviewers can reproduce it.
5.3 Prepare the M&A timeline for a second reviewer
Attach the source log and the baseline workbook to the review copy. In the review notes, identify the sources for the three milestone markers, the rule for including a row in a bar and the date of the last recalculation. If the output will be pasted into a deck, record the date range and workbook version beside the chart so that someone can check whether the picture still matches the current file.
Give the reviewer one test from each part of the workflow. Ask them to open the page behind a proposed price, check one buy-side or sell-side stage assignment and compare a filled endpoint with its formula cell. Assign unresolved questions to a named owner in the internal version of the M&A timeline. Keep the dated source and the decision about the open question together when the team updates it.
Before handing over the M&A timeline, give the reviewer three places to look: the original row with its page, the stage definition and the chart cell. In the practice guide, the two original prompts let you repeat that sequence on the same case. Download the five-page M&A timeline practice guide.
FAQs
What stages should an M&A timeline include?
Begin with the stages that your team uses for decisions and approvals. This M&A timeline has five buyer stages and four seller stages. Record the perspective for each mapping so different bidders or internal events stay identifiable.
How long did this deal take from signing to closing?
549 calendar days elapsed from signing on 15 January 2024 to closing on 17 July 2025. The earlier first-contact date in the workbook refers to Party 1 and captures the broader Ansys process. Define the M&A timeline endpoints before comparing this timing with another deal.
Does Excel move the coloured Gantt bars when the dates change?
In this workbook the bars are fixed fills. Regenerate or repaint them and reconcile the endpoints after editing a date, or implement and test formula-driven formatting in a separate copy.
Sources and exercise scope
- Ansys definitive proxy statement and Synopsys prospectus, 17 April 2024, “Background of the Merger,” printed pp. 51–68.
- Synopsys completion Form 8-K, 17 July 2025, Item 2.01.
- M&A Institute AI Lab 4 Part 1, exercises 1 and 2. Event rows and date labels refer to the recorded Excel outputs.
Your next M&A timeline task
Choose one date that could shift a review meeting. Trace it to the source, update it in a copy of the workbook and reconcile the affected bars with the formula cells. Then use the MADEX Certification Bundle to build and demonstrate your deal judgment in a practical assessment. MADEX certification is awarded after passing the assessment.