
Financial Modeling Course Structure
A Practical Learning Flow Built for Forecasting Judgment

How the Course Is Structured

Differentiated Learning Materials

AI-Powerd Simulation & Excel Model
Our Learning Interface
Financial Modeling Made Structured, Visual, and Practical

Our learning interface is designed to make complex financial data easier to understand, review, and apply.
- Scientifically Designed Three-Layer Interface
Every lesson follows a three-layer learning structure designed to help learners understand complex concepts quickly and intuitively.
-
# Left Panel: Structured Written ContentCarefully edited bullet points guide you through each concept with clarity. Even reading the text alone ensures full comprehension. As the audio plays, your eyes naturally follow along, reinforcing understanding through synchronized reading and listening.
-
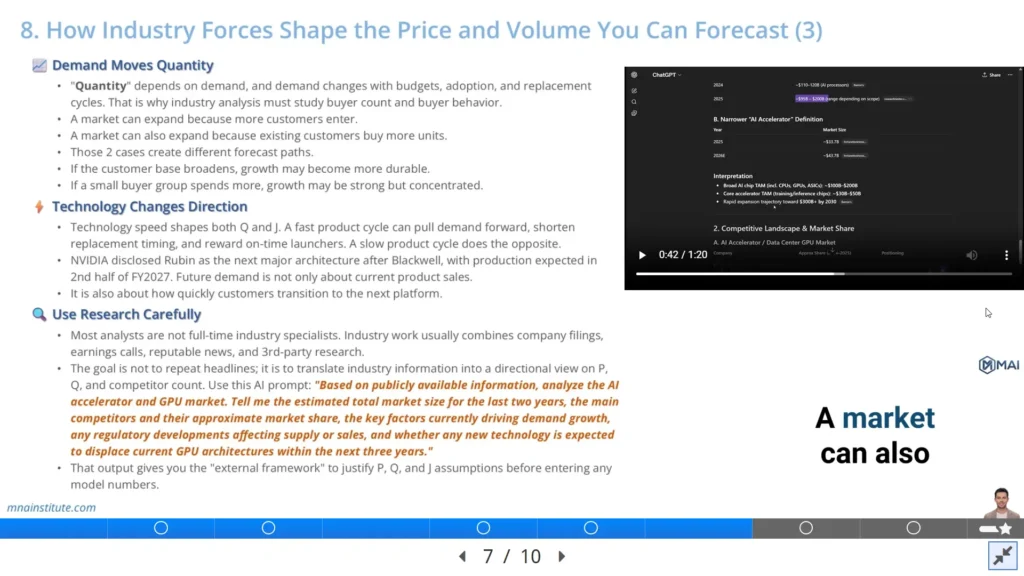
# Right Panel: Visual Infographics or Workflow Demonstrations
Colorful diagrams translate abstract ideas into concrete visuals. Where AI is applied, screen walkthroughs show the exact prompt, the model output, and the analyst's verification step.
-
# Bottom: Audio Narration with Real-Time Subtitles
Live subtitles appear word-by-word as you listen. Adjust playback speed (0.5x to 2x) to match your learning pace. Fullscreen mode available for immersive focus.
- -
Practical Application Quizzes
What you learn in the lesson becomes yours through targeted quizzes. Each question is designed with modeling scenarios, testing not just knowledge, but your ability to apply forecast logic, statement linkage, and analyst judgment in practice.-
- Applied Financial Analysis Tasks
Turn each lesson into practical modeling work. Complete focused tasks using 10-K filings, Yahoo Finance data, Google searches, Excel outputs, AI prompts, and forecast evidence. Learn how to extract signals, build assumptions, verify outputs, and convert analysis into EPS and FCF judgment.
The result? You do not just understand financial modeling.
You learn to build, verify, and explain a forecast model step by step using Excel and AI.
Course Content
Section I. What Analysts Build Before They Open a Spreadsheet
- Understand why a financial modeling course must produce EPS, EBITDA, FCFF, and valuation-ready outputs
- Learn how sell-side, buy-side, M&A, credit, and restructuring analysts use the same model differently
- Use AI for financial modelling to accelerate filing review while keeping final judgment with the analyst
-
Section II. The Blueprint Top Analysts Use Before Building a Model
- Use the NVDA modeling template as your structural blueprint across schedules, statements, and verification tabs
- Learn why model build order determines whether final EPS and FCF outputs are correct
- Read historical financials to extract modeling signals, not just trend lines or growth rates
-
Section III. Understanding the Business Before Forecasting Revenue and Cost
- Apply the Revenue = Σ Pj × Qj formula to every segment before touching a forecast cell
- Read product, value chain, and customer signals that determine pricing power and volume drivers
- Turn company analysis into quantified forecast logic that supports equity research financial modeling
-
Section IV. How to Build the Core Schedules That Make the Model Work
- Build revenue assumptions from business drivers, management guidance, and segment-level logic
- Model CapEx, PP&E, D&A, working capital, debt, interest, SBC, buybacks, and share count
- See how each schedule feeds the income statement, balance sheet, cash flow statement, EPS, and FCF
-
Section V. Complete the Three Statements from Your Schedules
- Build the income statement from revenue to gross profit, EBIT, EBITDA, tax, net income, and EPS
- Complete the balance sheet using schedule-driven assets, liabilities, equity, retained earnings, and cash
- Build the cash flow statement from net income to operating cash flow, investing cash flow, financing cash flow, and FCF
-
Section VI. Verify, Calibrate, and Stress-Test Your Completed Model
- Run the 6 verification checks to confirm that the three statement financial model actually works
- Calibrate your forecast against management guidance, consensus revenue, consensus EPS, and key assumptions
- Build Bull, Base, and Bear scenarios with sensitivity tables that test EPS and FCF ranges
-
Section VII. AI Simulation and Excel Execution
- Defend your modeling decisions across 10 progressive IC scenarios with the ArcLight Semiconductor target
- Build a complete NVIDIA Excel model using SEC filings, AI extraction, and source verification
- Receive instant scoring on theoretical accuracy, deal-specific relevance, and practical execution quality


Applied AI Prompting and Tasks
This financial modeling course applies AI across filing review, assumption building, model verification, and analyst commentary.
-
Reading 10-K Filings with AI
Use AI to extract business drivers, segment data, risk factors, and modeling signals from company filings, then verify each output against the source.
- -
Extracting Forecast Signals with AI
Use AI for financial modelling to organize management guidance, revenue drivers, pricing signals, volume trends, supply constraints, and market limitations.
- -
Building Revenue Assumptions
Convert business and industry research into P, Q, J, and C assumptions that support segment-level forecasting rather than generic growth rates.
- -
Completing the 3-Statement Model
Use Excel to connect revenue, margins, CapEx, D&A, working capital, debt, SBC, share count, EPS, and free cash flow.
- -
Verifying and Calibrating the Model
Run balance sheet, cash, net income, CapEx, D&A, and SBC checks before comparing outputs against guidance and consensus.
- -
And 4 more
Applied AI and Excel tasks across historical financial signals, Alphabet revenue drivers, debt structure extraction, guidance review, and Goal Seek calibration.
Your Course Deliverables
What You Will Analyze in This Financial Modeling Course
What You Will Analyze in This Financial Modeling Course
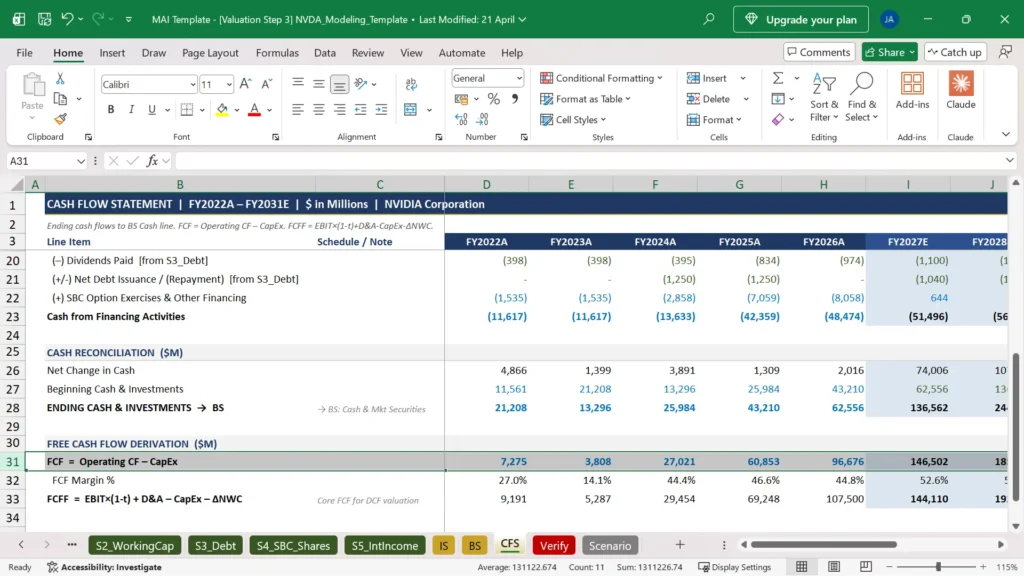
NVDA 3-Statement Modeling Template
- A professional Excel model built around NVIDIA, covering historical data, revenue assumptions, CapEx and D&A, working capital, debt, SBC, share count, income statement, balance sheet, cash flow statement, verification, and scenarios.
- This template shows how a company analysis course becomes a working forecast model.
You will learn how business research flows into assumptions, how assumptions flow into schedules, and how schedules produce EPS, EBITDA, FCF, and valuation-ready outputs.
You will master the practical workflow that turns raw 10-K data, AI-assisted research, and Excel formulas into a defensible three statement financial model for equity research.
AI-Powered Financial Modeling Practice
Task 1. AI Simulation: ArcLight Semiconductor IC Pressure Test
This is an AI-powered simulation where a Senior PM places you under Investment Committee review, testing your ability to convert company analysis into a defensible forecast model. You will act as Junior Equity Research Analyst at Meridian Growth Fund, building an initiation model for ArcLight Semiconductor, a fabless growth-stage chip company with 55% revenue growth, rising CapEx, and a new product line without historical data. You must defend your model across 10 progressive scenarios by:
- Justifying why business research must precede every modeling assumption
- Translating EdgeCore and NeuralEdge segment dynamics into Pj × Qj forecast inputs
- Building CapEx, D&A, working capital, and debt schedules under operating leverage stress
- Completing the three statements with verified BS Check and cash linkage
- Calibrating against management guidance and consensus before finalizing EPS
- Constructing Bull, Base, and Bear cases for the Investment Committee decision
Submit your response at each scenario and receive instant AI scoring
across theoretical accuracy, deal-specific relevance, and practical executability.
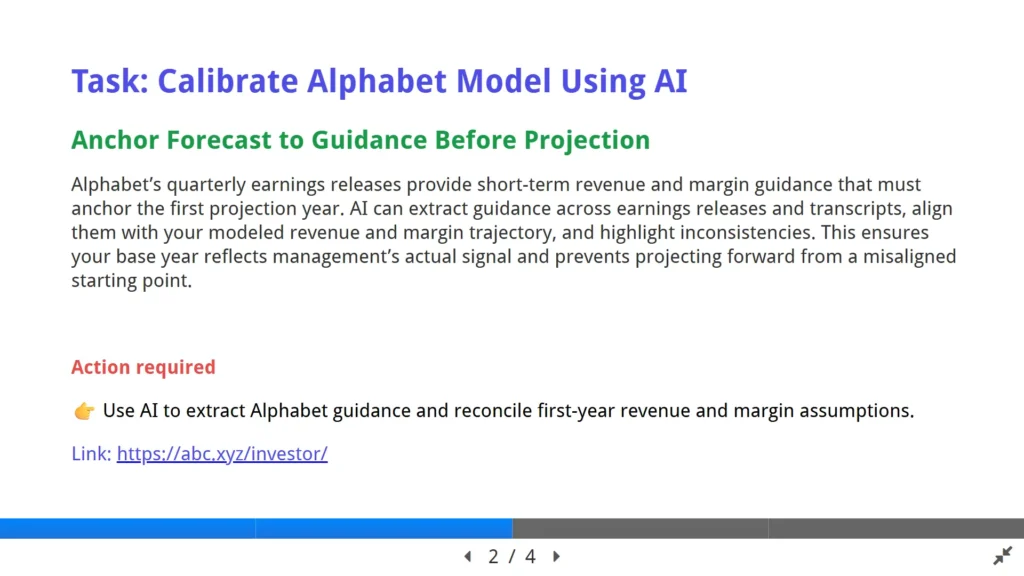
Task 2. Excel Modeling: Alphabet (Google) Simplified Modeling Task
This is an Excel execution module where you build a simplified single-sheet financial model on Alphabet, using 10-K data, AI-assisted extraction, and management guidance for calibration. You will act as a junior analyst preparing an Alphabet forecast model by:
- Setting segment growth assumptions for Google Advertising, Cloud, and Other using P, Q, J, C logic
- Constructing CapEx and working capital inputs that drive the simplified three-statement layout
- Using AI to extract Yahoo Finance data and verify each figure against the source 10-K filing
- Writing short commentary on whether your assumptions produce a Bull, Base, or Bear forecast case
Upload your completed Excel model and receive instant feedback
on modeling logic, formula discipline, forecast quality, AI use, and analyst judgment.
Sample Internal View of The Course
Visual Examples of Our Learning Tools
The images shown below are from another course and are included for reference only.


What You Will Gain from This Course
This online financial modeling course trains you to turn company analysis
into analyst-grade forecasts, EPS, FCF, and investment judgment.

Turn Business Research into Forecast Logic
Develop the ability to convert products, customers, industry forces, pricing power, and cost structure into defensible forecast assumptions. You will stop guessing growth and start modeling from business reality.

Build Models That Explain the Business
Learn how revenue, margins, CapEx, working capital, debt, shares, and cash flow connect inside a three statement financial model. You will see why every number must have a business reason.

Forecast EPS, EBITDA, and FCF with Judgment
Build the practical ability to forecast the outputs that drive valuation. You will connect operating profit, reinvestment, cash conversion, and share count to EPS, EBITDA, and FCF.

Use AI Without Losing Analyst Judgment
Apply AI for financial modelling to extract filings, organize assumptions, and review outputs efficiently. You will know what AI accelerates and what the analyst must verify independently.

Think Like an Equity Research Analyst
Develop the judgment used in equity research financial modeling to compare your forecast against guidance, consensus, and market expectations. You will explain exactly why your model differs.

Defend Forecasts Under Review Pressure
Practice turning model outputs into clear investment conclusions. You will defend revenue drivers, margin assumptions, scenario ranges, and valuation logic with the discipline expected from a serious company analysis course.

Who Made This Course?
Built by the M&A Institute team, where real finance experience meets training design.
This financial modeling course was architected by experts with over 10~20 years of combined experience in M&A, Private Equity, Corporate Finance, Valuation, and Corporate Strategy.
Bridging the gap between company analysis, equity research financial modeling, and real investment decision-making, we have translated the actual forecasting frameworks of finance professionals into a practical, rigorous curriculum.
Content Built on Battle-Tested Experience
● Our curriculum is derived from actual experience in Cross-border M&A, Venture Capital, Corporate Buyouts, IPOs, and Mezzanine Financing.
● We utilize the exact analysis frameworks, Excel templates, and decision logic used by CFA/MBA professionals in top-tier firms.
● The content is verified by practitioners in New Business Strategy, Corporate Finance, Research Centers, IB Divisions, and PE Teams.
● Our instructors have delivered over 200 corporate training sessions to global firms and financial institutions, educating over 8,000 professionals.
What Our Corporate Clients Say:
