
Financial Statement Analysis Course Structure
A Practical Learning Flow Built for Analyst Judgment

How the Course Is Structured

Differentiated Learning Materials

AI-Powerd Simulation & Excel Model
Our Learning Interface
Financial Analysis Made Structured, Visual, and Practical

Our learning interface is designed to make complex financial data easier to understand, review, and apply.
- Scientifically Designed Three-Layer Interface
Every lesson follows a three-layer learning structure designed to help learners understand complex concepts quickly and intuitively.
-
# Left Panel: Structured Written ContentCarefully edited bullet points guide you through each concept with clarity. Even reading the text alone ensures full comprehension. As the audio plays, your eyes naturally follow along, reinforcing understanding through synchronized reading and listening.
-
# Right Panel: Visual Infographics or Workflow Demonstrations
Colorful diagrams translate abstract ideas into concrete visuals. Where AI is applied, screen walkthroughs show the exact prompt, the model output, and the analyst's verification step.
-
# Bottom: Audio Narration with Real-Time Subtitles
Live subtitles appear word-by-word as you listen. Adjust playback speed (0.5x to 2x) to match your learning pace. Fullscreen mode available for immersive focus.
- -
Practical Application Quizzes
What you learn in the lesson becomes yours through targeted quizzes. Each question is designed with real-world scenarios, testing not just knowledge, but your ability to apply these concepts in actual deal situations. You'll discover exactly how to use what you've learned in practice.-
- Applied Financial Analysis Tasks
Turn each lesson into practical analyst work. Complete focused tasks using 10-K filings, Yahoo Finance data, Excel outputs, AI prompts, and financial statement evidence. Learn how to extract data, test assumptions, verify figures, and convert analysis into investment judgment.
The result? You do not just understand financial statements.
You learn to analyze them, step by step, using AI.
Course Content
Section I. How Investment Analysts Read Financial Statements
- Understand how bankers, equity analysts, PE investors, and credit analysts read the same statements differently
- Connect financial statement analysis to valuation multiples, DCF inputs, risk filters, and investment conclusions
- Use AI to accelerate 10-K review while keeping final judgment with the analyst
-
Section II. Decoding the Income Statement Like an Analyst
- Read the income statement from revenue to gross profit, operating income, EBITDA, and net income
- Assess revenue quality through recognition policy, recurring revenue, receivables, and cash conversion
- Analyze cost structure, operating leverage, profit quality, and normalized earnings for valuation use
-
Section III. What the Balance Sheet Reveals About a Business
- Interpret assets, liabilities, equity, liquidity, working capital, net debt, and capital structure
- Separate operating assets from non-operating assets before using numbers in valuation analysis
- Identify leverage risk, debt-like items, cash-like items, and enterprise value adjustments
-
Section IV. Cash Flow Analysis and FCF Construction
- Reconcile net income to operating cash flow using non-cash charges and working capital movements
- Read CFO, CFI, and CFF patterns to assess growth, maturity, distress, and capital discipline
- Build free cash flow from operating cash flow and CapEx for DCF and valuation analysis
-
Section V. Applied Financial Analysis with Excel and AI
- Build financial statement analysis using Excel across growth, margins, liquidity, efficiency, and FCF
- Use AI to clean Yahoo Finance data and convert raw figures into model-ready tables
- Compare Microsoft and Apple using AI-assisted ratio analysis, financial trends, and valuation signals
-
Section VI. The Tools That Set Analysts Apart
- Apply industry-specific frameworks so each financial statement line is interpreted in the right context
- Use sector KPIs, unit economics, and valuation linkages to avoid generic financial analysis
- Work through AI prompts for extraction, ratio calculation, normalization, red flags, and commentary
-
Section VII. AI Simulation and Excel Execution
- Complete a NVIDIA FS Ratio Modeling Task using Excel, 10-K data, and verified source inputs
- Enter the Financial Statement Deal Analysis Lab and evaluate a hybrid SaaS acquisition target
- Defend growth quality, EBITDA, FCF, net debt, ROIC, multiples, and investment judgment with AI feedback


Applied AI Prompting and Tasks
This financial statement analysis course applies AI across data extraction, model building, and analyst interpretation.
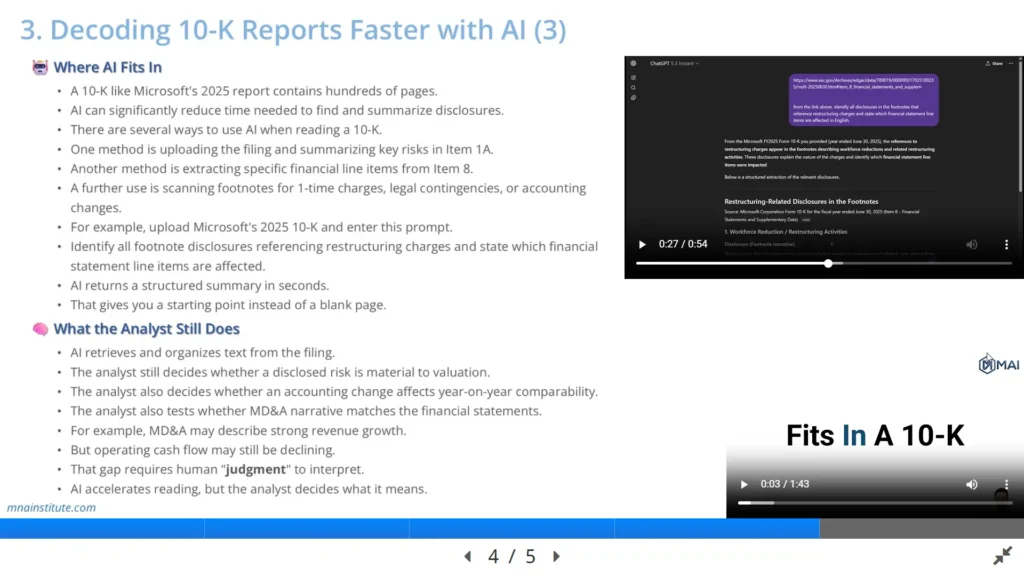
- Reading 10-K Filings with AI
Use AI to summarize Item 1A risk factors and Item 8 footnotes on NVIDIA's actual SEC filing, then verify each output against the source.
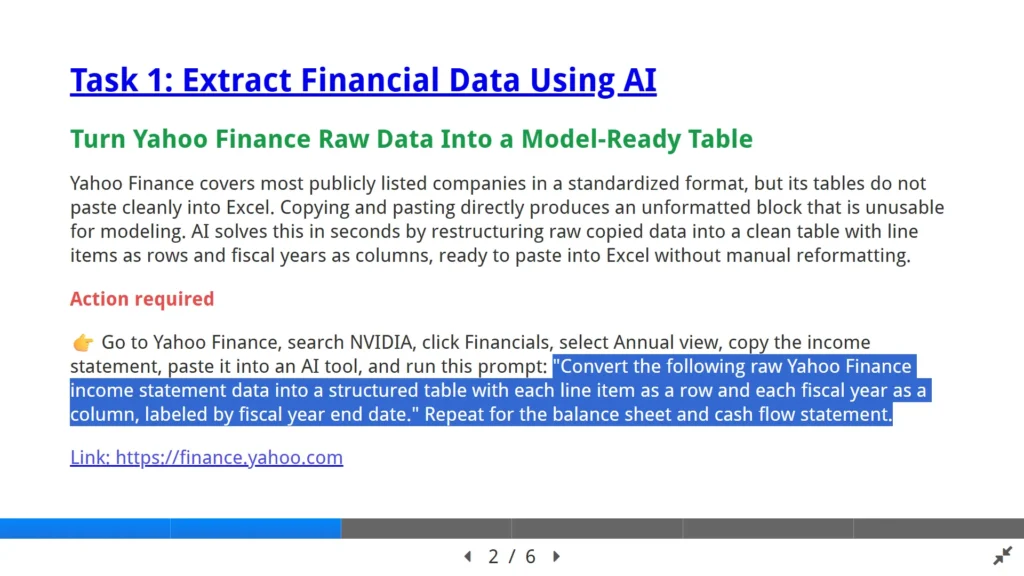
- - Extracting Yahoo Finance Data with AI
Convert raw Yahoo Finance tables into model-ready Excel inputs with AI prompts, transforming hours of manual reformatting into seconds of structured output.
- - Building a Three-Statement Model
Construct NVIDIA's income statement, balance sheet, and cash flow tabs with formula-driven EBITDA, working capital, net debt, and free cash flow rows.
- - Side-by-Side Comparison with AI
Run NVIDIA vs AMD across growth, profitability, financial safety, and valuation multiples — generating a three-paragraph investment summary refined by analyst judgment.
- - Citadel-Style AI Workflow
Apply AI to accelerate first-draft work while keeping interpretation, valuation, and risk judgment with the analyst — the working model used at top investment funds.
- - And 4 more
applied AI tasks across earnings quality, DuPont decomposition, valuation multiples, and industry framework application across 8 sectors
Your Course Deliverables
3 Professional Templates in This Financial Statement Analysis Course
What You'll Analyze in This Financial Statement Analysis Course
- MSFT Financial Analysis Excel Model
Pre-built nine-sheet Excel template covering income statement, balance sheet, cash flow, and four full analysis layers — growth, safety, activity, profitability, and valuation multiples — using actual Microsoft data, ready to apply to any public company you analyze.
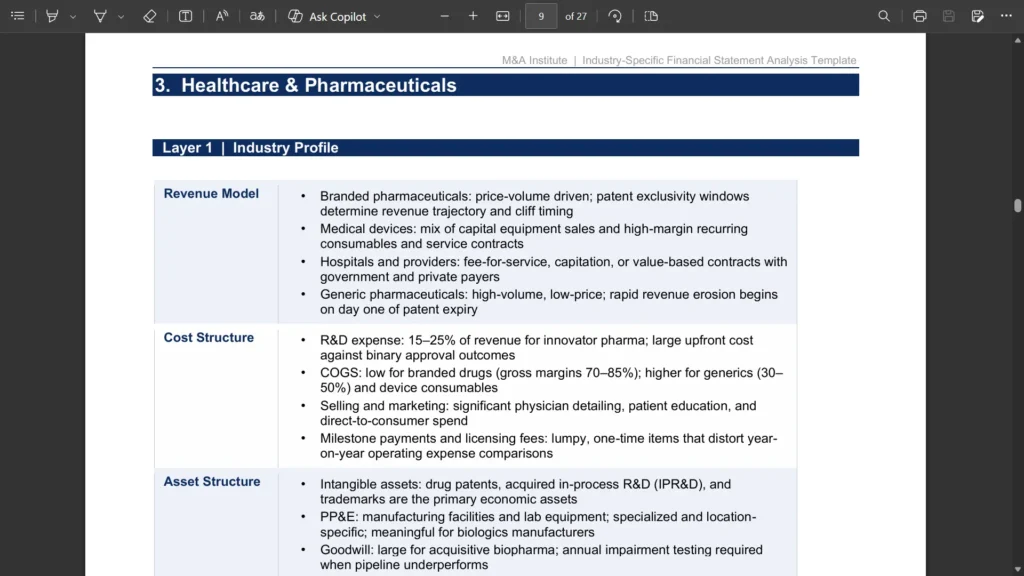
- - Industry-Specific FS Analysis Template
Practitioner reference covering 8 global industries — Tech, SaaS, Banking, Pharma, Semis, REITs, Energy, Consumer — across 4 analytical layers including revenue model, cost structure, ratio meaning, and valuation linkage applied during financial statement analysis training.
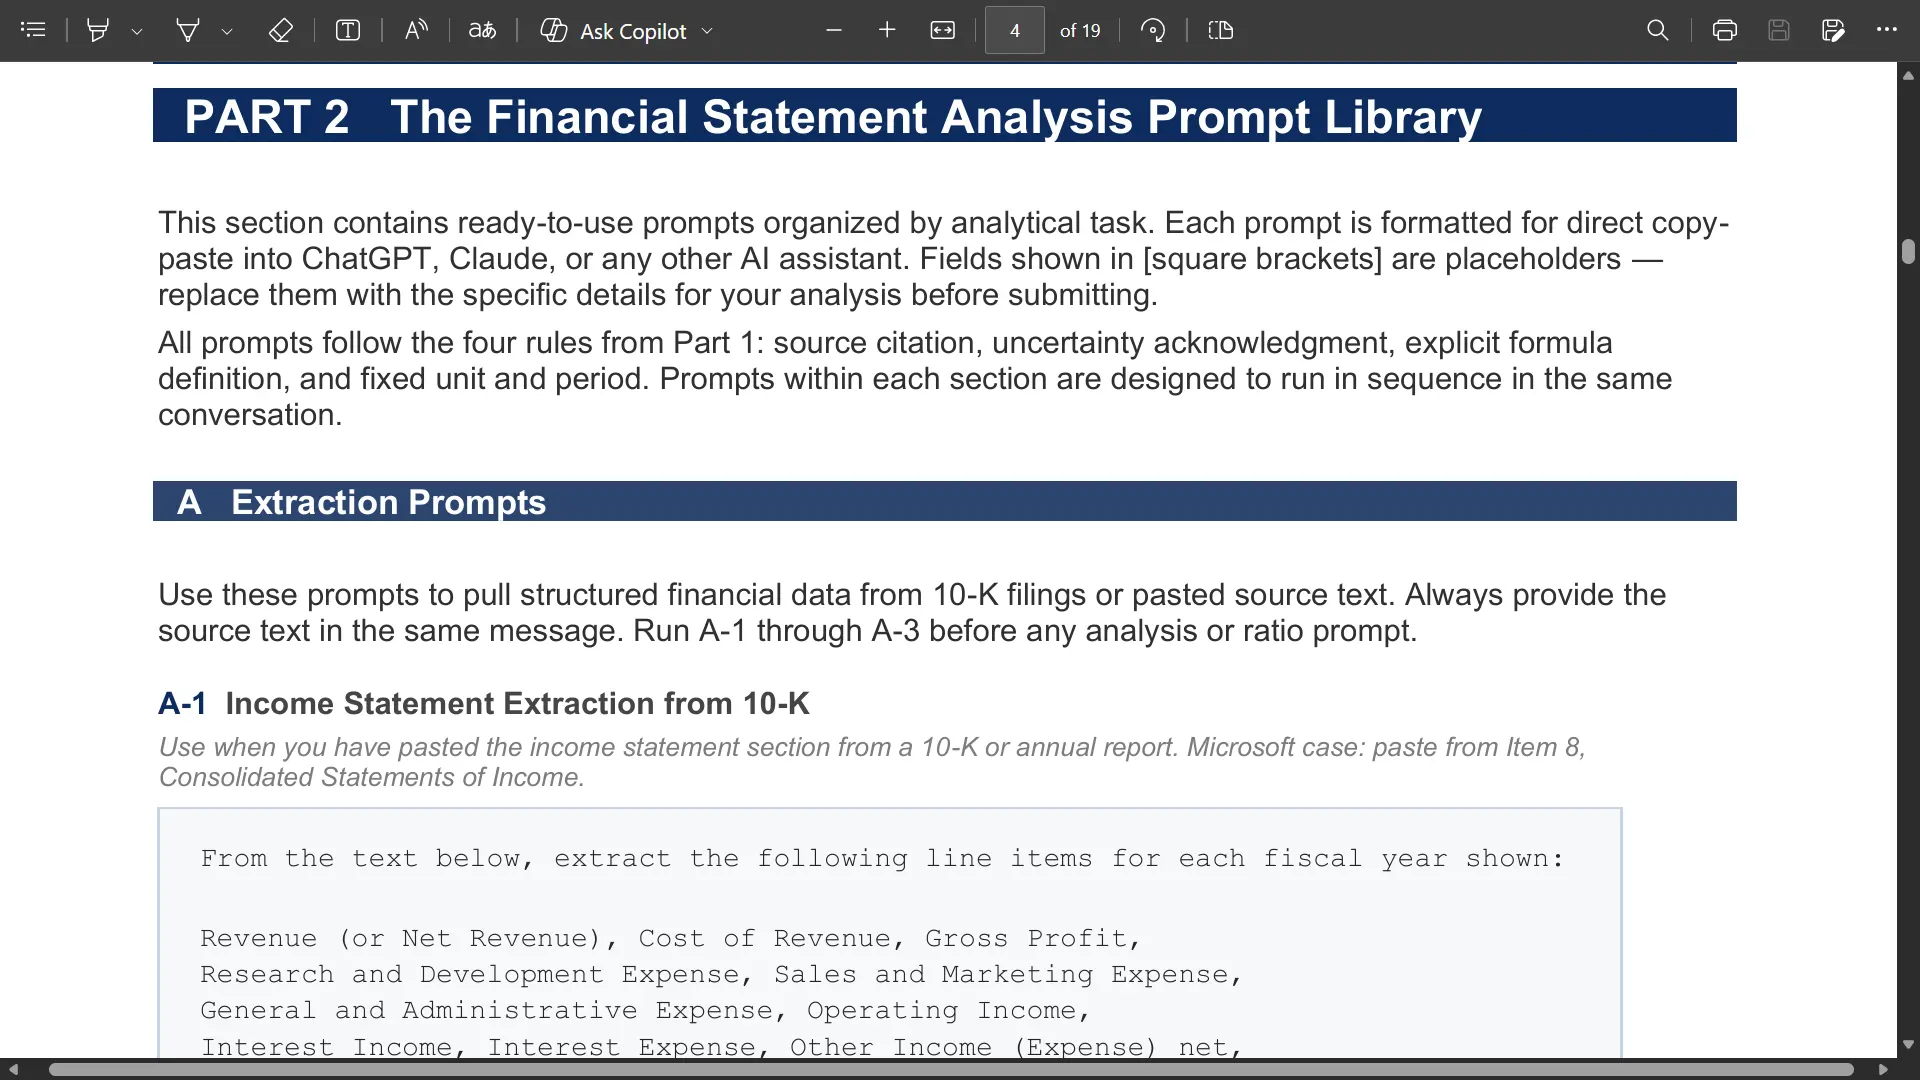
- - AI Prompt Playbook for Financial Analysis
21-prompt library with prompt engineering rules, organized across extraction, ratio calculation, normalization, risk identification, and analyst commentary — the working reference for AI for financial statement analysis on any public company.
You will master the exact analyst workflow that converts raw 10-K data into investment, credit, and valuation judgment, replacing manual reformatting with structured AI execution at every stage of this financial statement analysis online course.
AI-Powered Financial Statement Analysis Practice
Task 1. AI Simulation - Financial Statement Deal Analysis Lab
This is an AI-powered simulation where each scenario places you under CFO review, testing your ability to convert financial statement evidence into acquisition judgment.
You will act as Corporate Development Lead at Apex Industrial Software, evaluating SignalWorks Analytics, a hybrid SaaS, hardware, and services target with strong growth claims but weak cash conversion.
You must assess the target across 10 progressive scenarios by:
- Testing whether 35% revenue CAGR is recurring, cash-backed, and sustainable
- Separating SaaS, hardware, services, and customization revenue quality
- Classifying fixed, variable, and mixed costs to test the operating leverage story
- Building a normalized EBITDA view instead of accepting seller adjusted EBITDA
Evaluating OCF, CapEx, FCF, working capital, net debt, ROIC, and multiples - Deciding whether the valuation deserves a premium, discount, renegotiation, or walk-away
Submit your response at each scenario and receive instant AI scoring
across theoretical accuracy, deal-specific relevance, and practical decision quality.
Task 2. AI-Powered Excel Modeling - NVIDIA FS Ratio Modeling Task
This is an Excel execution module where you analyze NVIDIA as a global AI infrastructure benchmark, using annual filing data, source verification, and a simplified one-sheet financial analysis model.
You will act as a junior analyst preparing NVIDIA financial statement analysis by:
- Building source inputs from income statement, balance sheet, cash flow, and market data
- Calculating growth, margins, EBITDA, liquidity, leverage, efficiency, cash conversion, and FCF
- Using AI to structure raw data, then verifying key figures against the latest annual filing
- Writing short analyst commentary on whether growth, profitability, and cash flow support valuation logic
Upload your completed Excel and receive instant feedback
on this final task of the financial statement analysis course.
Sample Internal View of The Course
Visual Examples of Our Learning Tools
The images shown below are from another course and are included for reference only.


What You Will Gain from This Course
This online financial statement analysis course trains you
to read, model, and analyze any company with analyst-grade judgment.

Read Any 10-K Like a Working Analyst
Develop the ability to navigate any annual filing with speed and structure. You will know exactly where revenue quality, risk factors, debt terms, and accounting policy changes hide inside an SEC 10-K.

Detect Earnings Quality Issues Before Others Do
Identify red flags that separate real earnings from accounting noise. You will learn to spot receivables outpacing revenue, weak cash conversion, deferred revenue distortions, and one-time non-operating gains inflating reported profit figures.

Analyze Ratios and DuPont to Defend Conclusions
Perform full ratio analysis across growth, safety, activity, profitability, and DuPont decomposition. You will defend valuation, and investment conclusions using ratio-based evidence rather than narrative, seller commentary, or general analyst consensus.

Use AI Without Losing Analyst Judgment
Apply AI throughout financial analysis to extract data, calculate ratios, and draft analyst commentary efficiently. You will know exactly which steps AI accelerates and which require independent analyst verification and final judgment.

Adapt Analysis to Any Industry Context
Interpret financial statements correctly across Tech, SaaS, Banking, Pharma, Semiconductors, REITs, Energy, and Consumer sectors. You will avoid generic financial analysis by applying industry-specific frameworks, sector KPIs, and valuation linkages.

Convert Analysis into Real Investment Decisions
Practice the financial statement analysis course content in AI simulation and Excel execution under realistic deal pressure. You will receive instant feedback to convert raw filings into defensible investment, credit, and acquisition judgment.

Who Made This Course?
Built by the M&A Institute team, where real finance experience meets training design.
This financial statement analysis course was architected by experts with over 10 to 20 years of combined experience in M&A, Private Equity, Corporate Finance, Valuation, and Corporate Strategy.
Bridging the gap between financial statement analysis training and real investment decision-making, we have translated the actual analytical frameworks of finance professionals into a practical, rigorous curriculum.
Content Built on Battle-Tested Experience
● Our curriculum is derived from actual experience in Cross-border M&A, Venture Capital, Corporate Buyouts, IPOs, and Mezzanine Financing.
● We utilize the exact analysis frameworks, Excel templates, and decision logic used by CFA/MBA professionals in top-tier firms.
● The content is verified by practitioners in New Business Strategy, Corporate Finance, Research Centers, IB Divisions, and PE Teams.
● Our instructors have delivered over 200 corporate training sessions to global firms and financial institutions, educating over 8,000 professionals.
What Our Corporate Clients Say:
