FCFF Formula: Free Cash Flow to the Firm in 5 Steps
Understand free cash flow to the firm meaning and the FCFF formula.
The FCFF formula converts accounting profit into free cash flow to the firm for valuation.
See the full FCFF calculation from EBIT to FCFF using NVIDIA FY2026 figures.

Why FCFF Starts the Valuation Conversation
In valuation, the first serious question is not how much accounting profit a company reports.
The first serious question is how much cash the operating business can generate after paying taxes and reinvesting enough to keep growing.
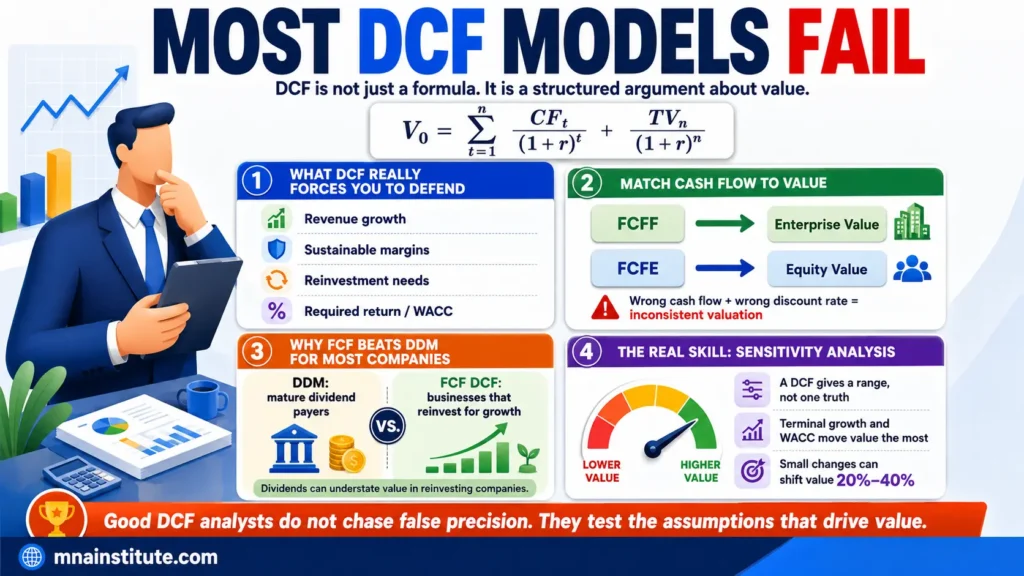
That is why the FCFF formula sits at the center of discounted cash flow valuation.
Free cash flow to the firm measures cash available to all capital providers before financing decisions split that cash between debt holders and shareholders.
This distinction matters because enterprise value reflects the value of the entire operating business, not only the equity slice.
If an analyst discounts future free cash flow to the firm at WACC, the result is enterprise value.
That enterprise value can then be bridged to equity value by subtracting net debt and other senior claims.
For a beginner, FCFF meaning can sound abstract because it sits between operating profit and valuation output.
For a practitioner, FCFF is a disciplined way to convert accounting statements into cash flow that can be discounted.
This article explains the FCFF formula, the logic behind each component, and a complete FCFF calculation example using NVIDIA FY2026 figures from the course case.

From Revenue to Cash That Belongs to Everyone
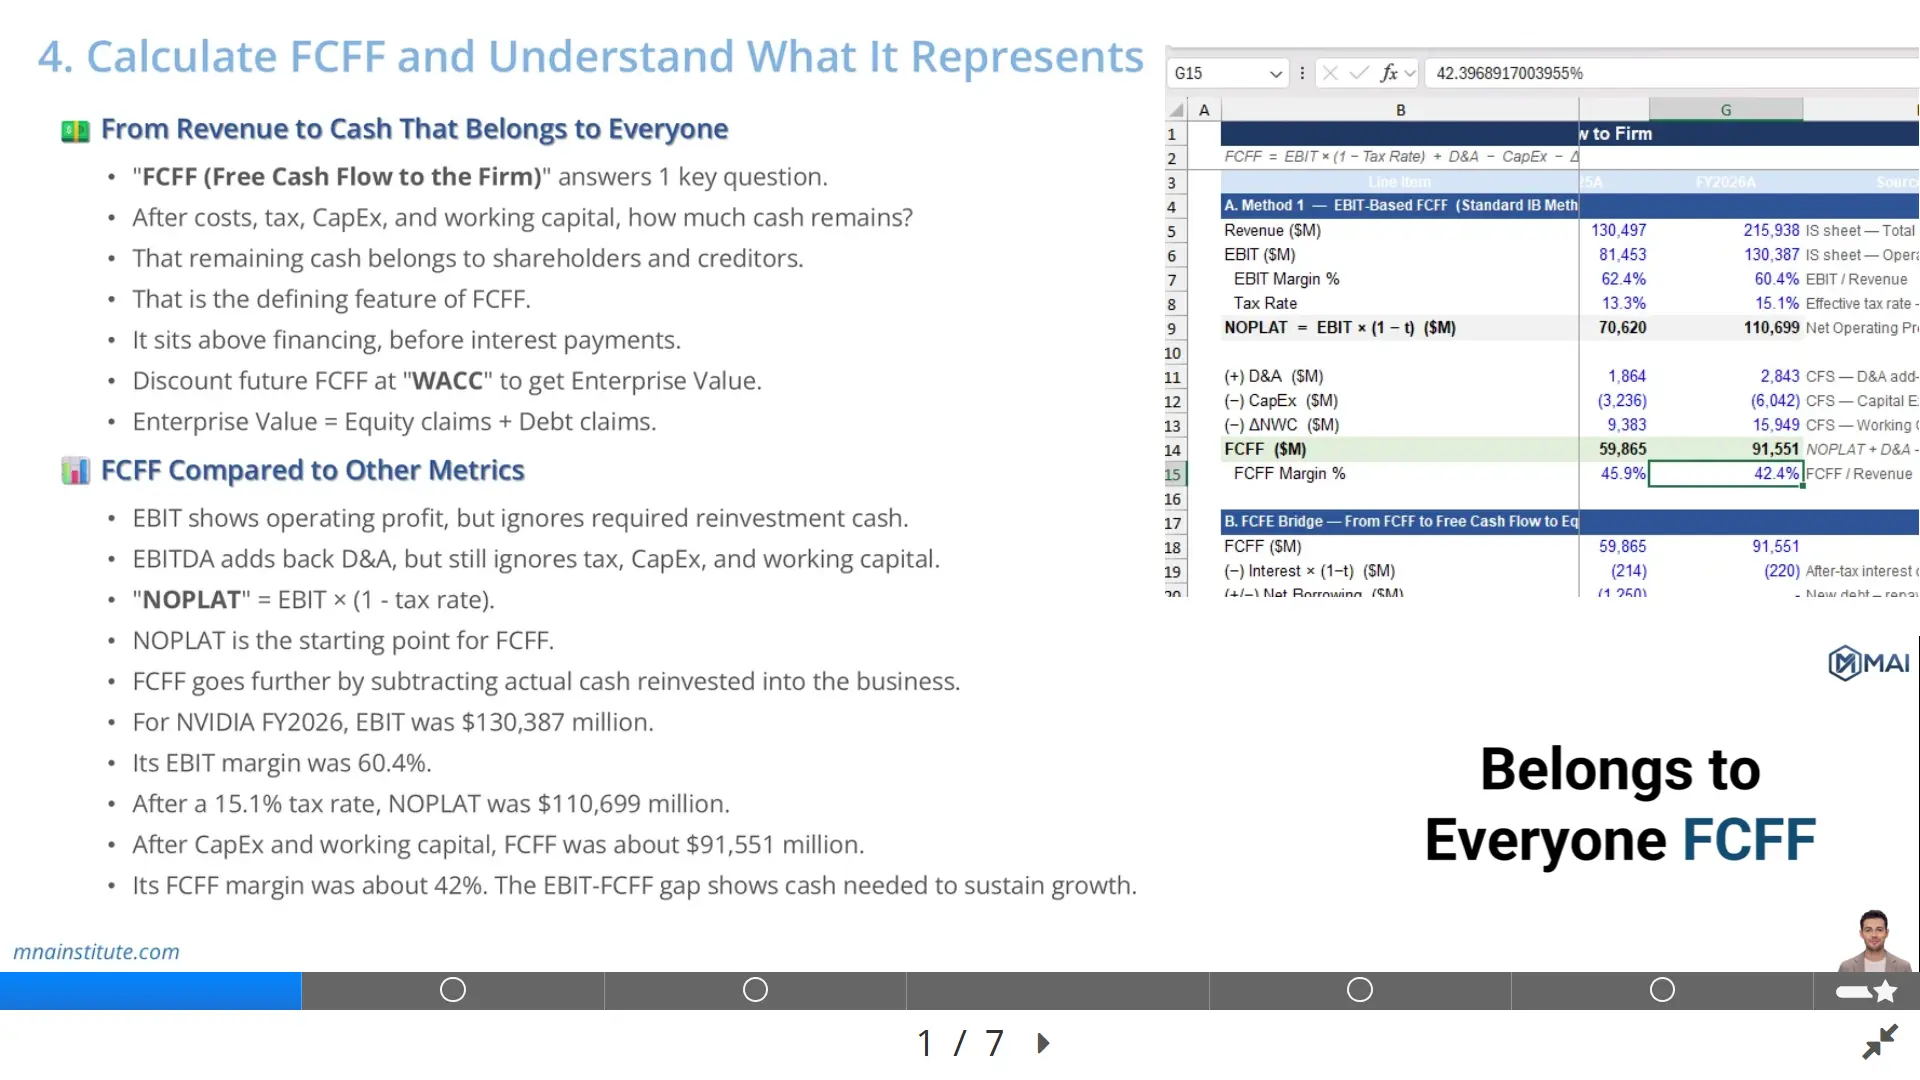
Free cash flow to the firm answers one direct question.
After a company covers operating costs, pays operating taxes, invests in capital expenditure, and funds working capital, how much cash remains for everyone who funded the business?
The answer belongs to both shareholders and creditors because FCFF is calculated before interest payments are deducted.
That is the central FCFF meaning: it is cash flow to the firm, not cash flow only to equity holders.
A lender has a contractual claim on part of the company’s cash flow through interest and principal repayment.
A shareholder owns the residual claim after creditors have been served.
Free cash flow to the firm sits above that financing split.
It is therefore the cash flow that should be paired with WACC, because WACC reflects the required return of both debt and equity capital providers.
This is also why FCFF is commonly used in investment banking, equity research, corporate finance, and M&A valuation for non-financial companies.
It separates operating performance from capital structure noise.
A business with 10 percent debt and the same business with 50 percent debt may have different equity risk, but the operating assets can still generate the same FCFF before financing choices are considered.
That is why the FCFF formula gives analysts a cleaner way to value operations.
It asks what the operating business produces before deciding how that production is divided between debt and equity.
This framing is useful when comparing companies with different leverage levels, different interest expense profiles, or different financing strategies.
For example, two semiconductor businesses can generate similar revenue and operating margins but have very different debt structures.
Using net income alone would mix operating performance with financing decisions.
Using free cash flow to the firm keeps the operating business visible before the capital structure layer enters the valuation.
FCFF Compared to EBIT, EBITDA, and NOPLAT
A strong FCFF calculation begins by understanding what FCFF is not.
EBIT measures operating profit before interest and tax.
It is useful because it focuses on business operations before financing costs.
However, EBIT is still an accounting profit figure, not a cash flow figure.
EBIT ignores the cash a company must spend on factories, servers, logistics capacity, research infrastructure, or other long-term assets.
It also ignores the cash consumed when revenue growth requires more receivables, inventory, or supplier funding.
EBITDA moves one step closer to cash flow by adding back depreciation and amortisation.
That makes EBITDA useful when comparing companies across different depreciation policies or capital structures.
But EBITDA still ignores taxes, capital expenditure, and working capital needs.
This is why EBITDA can overstate cash generation for asset-heavy or rapidly growing companies.
NOPLAT, or Net Operating Profit Less Adjusted Taxes, starts to solve the tax problem.
NOPLAT is EBIT after tax and is the usual operating profit base for the FCFF formula.
However, NOPLAT still does not subtract the reinvestment required to sustain and expand the business.
Free cash flow to the firm goes further by subtracting CapEx and change in net working capital after adding back non-cash D&A.
That is why FCFF is a more complete valuation cash flow than EBIT, EBITDA, or NOPLAT.
A company can report strong EBITDA and still produce much lower FCFF if growth consumes large amounts of working capital or if the business requires heavy capital expenditure.
A company can also report strong EBIT but have weaker free cash flow to the firm if depreciation understates the cash needed for future investment.
The analyst’s job is to understand that gap rather than ignore it.
|
Metric |
What it measures |
What it misses |
Valuation implication |
|
EBIT |
Operating profit before interest and tax |
Cash tax, CapEx, working capital, D&A timing |
Good operating starting point but not distributable cash |
|
EBITDA |
EBIT plus D&A |
Tax, CapEx, working capital, true reinvestment burden |
Useful proxy but often too generous |
|
NOPLAT |
After-tax operating profit |
CapEx and working capital reinvestment |
Good bridge to FCFF |
|
FCFF |
Cash available to debt and equity capital providers |
Financing split after enterprise value |
Cash flow discounted at WACC to derive enterprise value |

The FCFF Formula in 5 Steps
The standard investment banking FCFF formula starts with EBIT and then adjusts for tax, non-cash expenses, capital expenditure, and working capital.
The formula is straightforward, but the interpretation is where analyst judgment begins.
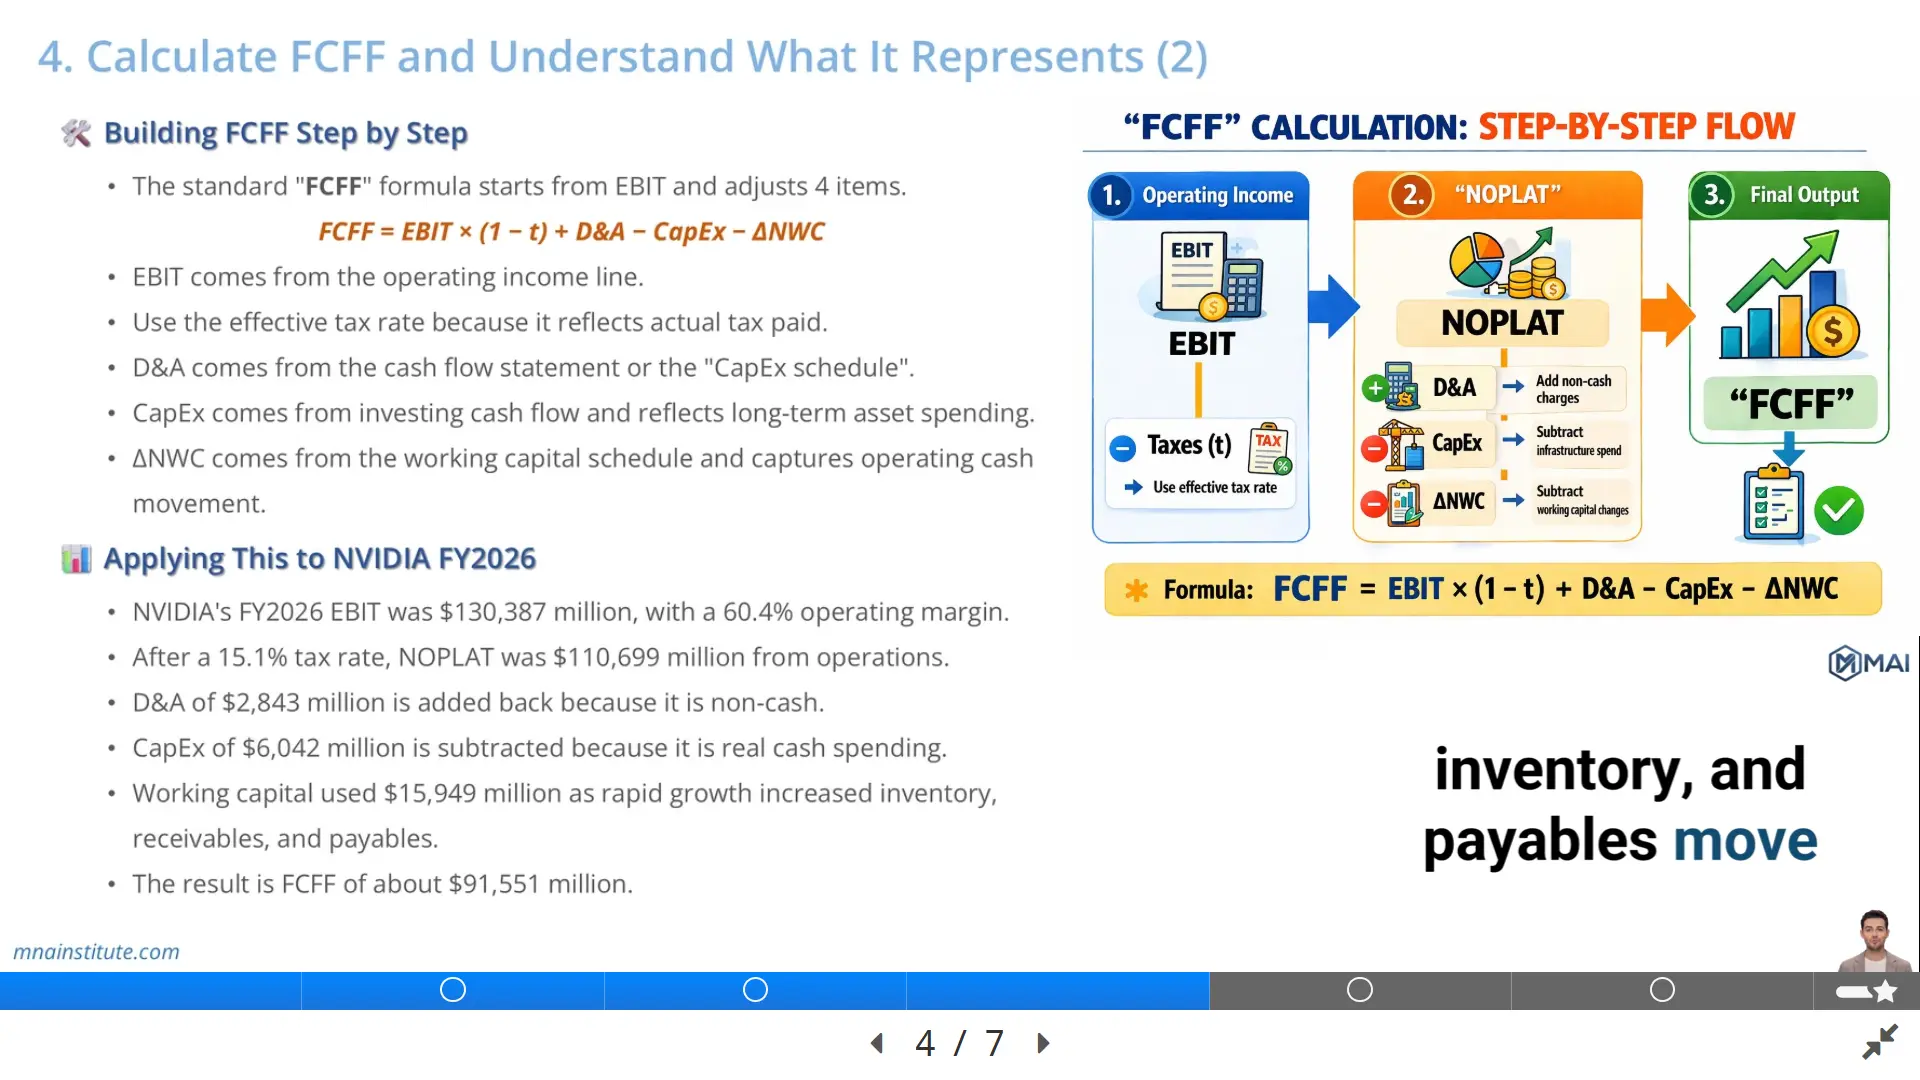
FCFF = EBIT × (1 − t) + D&A − CapEx − ΔNWC
This FCFF formula can be understood in five steps.
- Step 1: Start with EBIT. EBIT comes from the income statement, usually reported as operating income, and represents profit generated by the operating business before financing costs.
- Step 2: Apply the effective tax rate. The tax rate should reflect the tax burden actually associated with operating profit, and many practical models begin with the effective tax rate before normalizing future tax assumptions.
- Step 3: Add back D&A. Depreciation and amortisation reduce EBIT, but they are non-cash expenses in the period, so they must be added back in the FCFF calculation.
- Step 4: Subtract CapEx. Capital expenditure is real cash spent on property, equipment, infrastructure, and long-term operating assets that sustain or expand the business.
- Step 5: Subtract the increase in net working capital. If receivables or inventory rise faster than payables, cash is trapped in operations and must be removed from free cash flow to the firm.
This five-step structure helps junior analysts avoid a common mistake.
They may stop at EBITDA and treat it as cash flow.
That is usually too crude for DCF valuation.
The FCFF formula forces the model to capture tax, asset reinvestment, and working capital intensity.
It also makes business quality visible.
A high-margin company with low CapEx and efficient working capital may convert a large share of EBIT into FCFF.
A high-growth company with heavy inventory build, long customer receivable cycles, and high infrastructure spending may convert far less.
That conversion difference is often more important than the margin itself.

What Each FCFF Calculation Input Tells You
An FCFF calculation should not be treated as a mechanical Excel exercise.
Each line tells the analyst something about the economics of the business.
EBIT shows operating profitability before financing choices.
If EBIT margin is rising, the business may be gaining pricing power, operating leverage, or cost discipline.
If EBIT margin is falling, the business may be facing price pressure, cost inflation, mix deterioration, or underutilized capacity.
The tax line converts accounting operating profit into after-tax operating profit.
The effective tax rate can reflect jurisdiction mix, tax credits, stock-based compensation effects, and other items that may not repeat in the long term.
That is why an analyst should understand the current tax rate before simply projecting it forward.
D&A is added back because it is non-cash in the current period.
However, a high D&A add-back does not mean the business is capital-light.
If D&A is high because the business owns expensive assets, future maintenance CapEx may also be high.
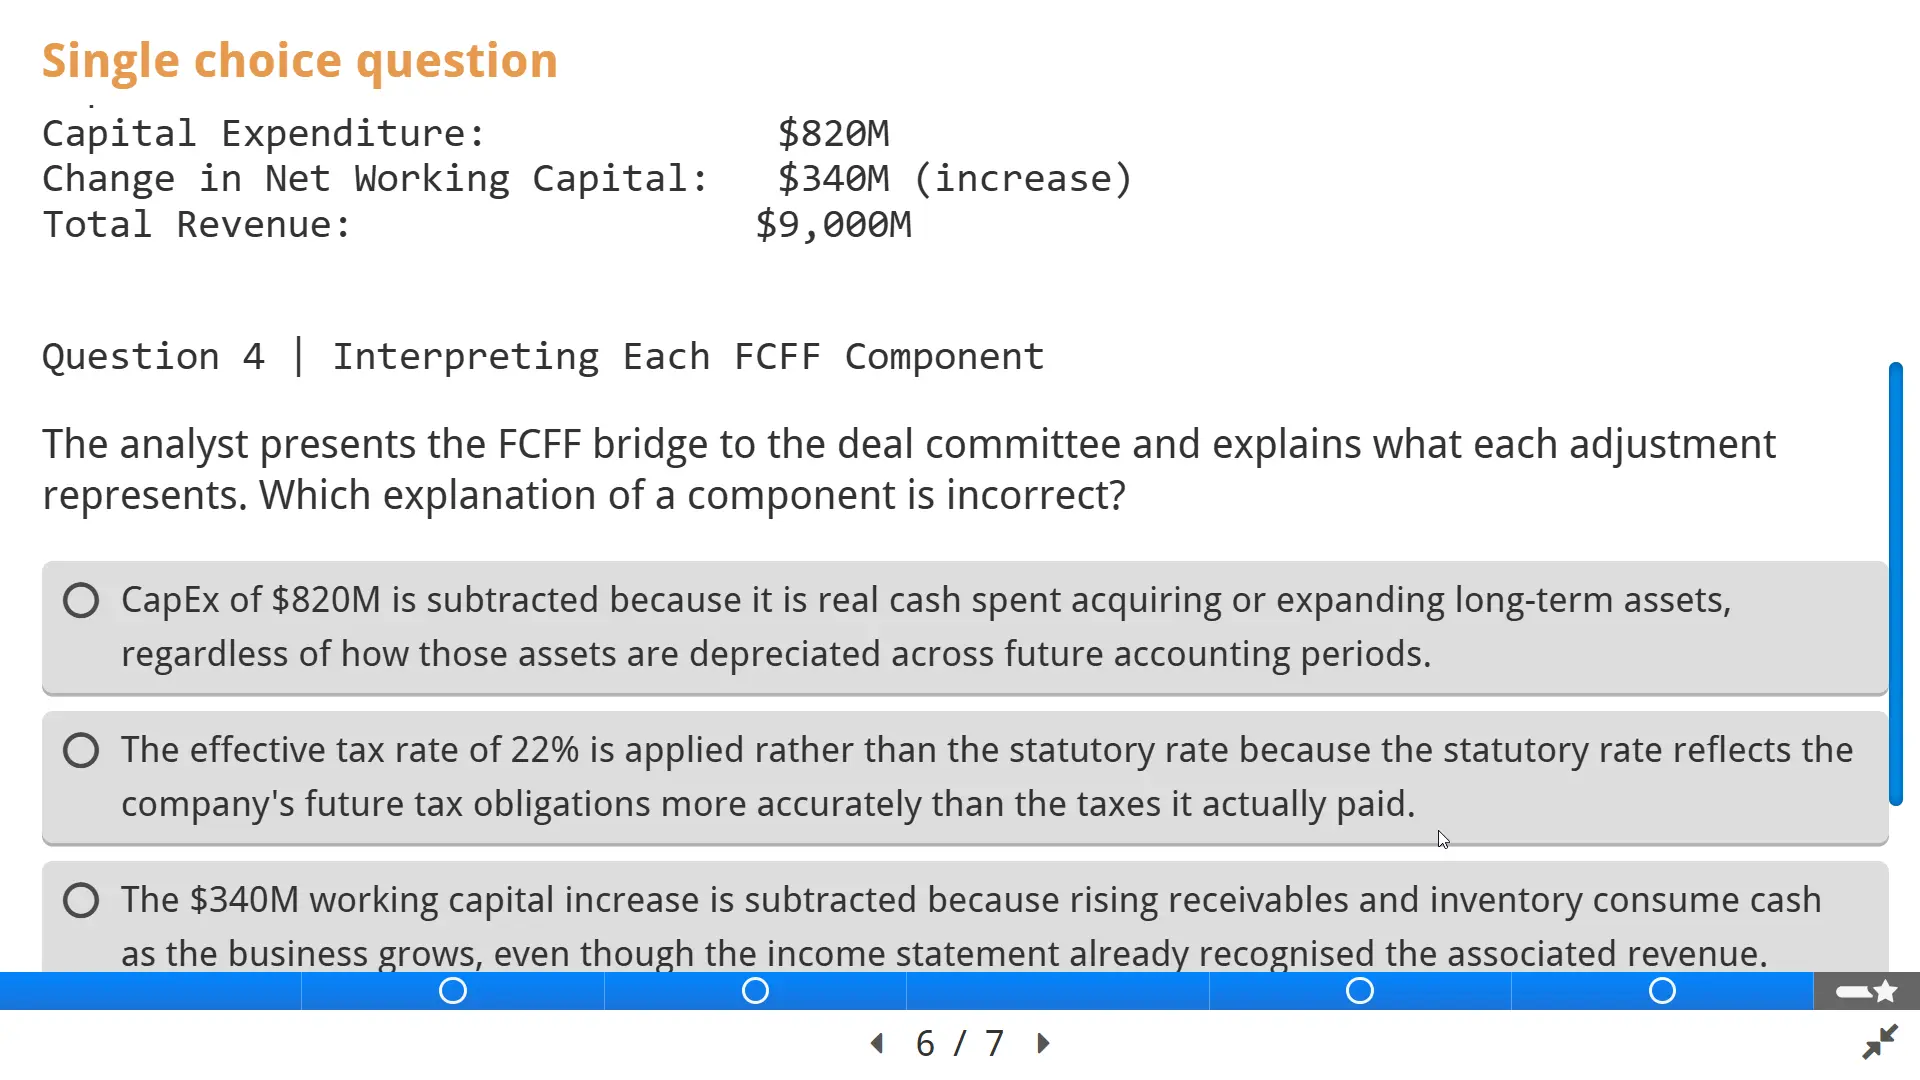
CapEx is subtracted because it represents cash reinvestment in the asset base.
For a fast-growing data center, semiconductor, or infrastructure business, CapEx may represent capacity expansion that supports future revenue.
For a mature utility, CapEx may represent maintenance and regulatory reliability spending.
The change in net working capital captures the cash impact of operating growth.
When revenue grows, accounts receivable may grow because customers have not yet paid cash.
Inventory may grow because the company must hold products or components before sale.
Payables may offset part of that burden if suppliers provide financing through payment terms.
The FCFF formula captures this operating cash cycle rather than ignoring it.

Applying the FCFF Formula to NVIDIA FY2026
The course uses NVIDIA FY2026 as a practical FCFF calculation example.
The purpose is not to turn the blog into a stock recommendation.
The purpose is to show how a real analyst moves from reported operating profit to free cash flow to the firm.
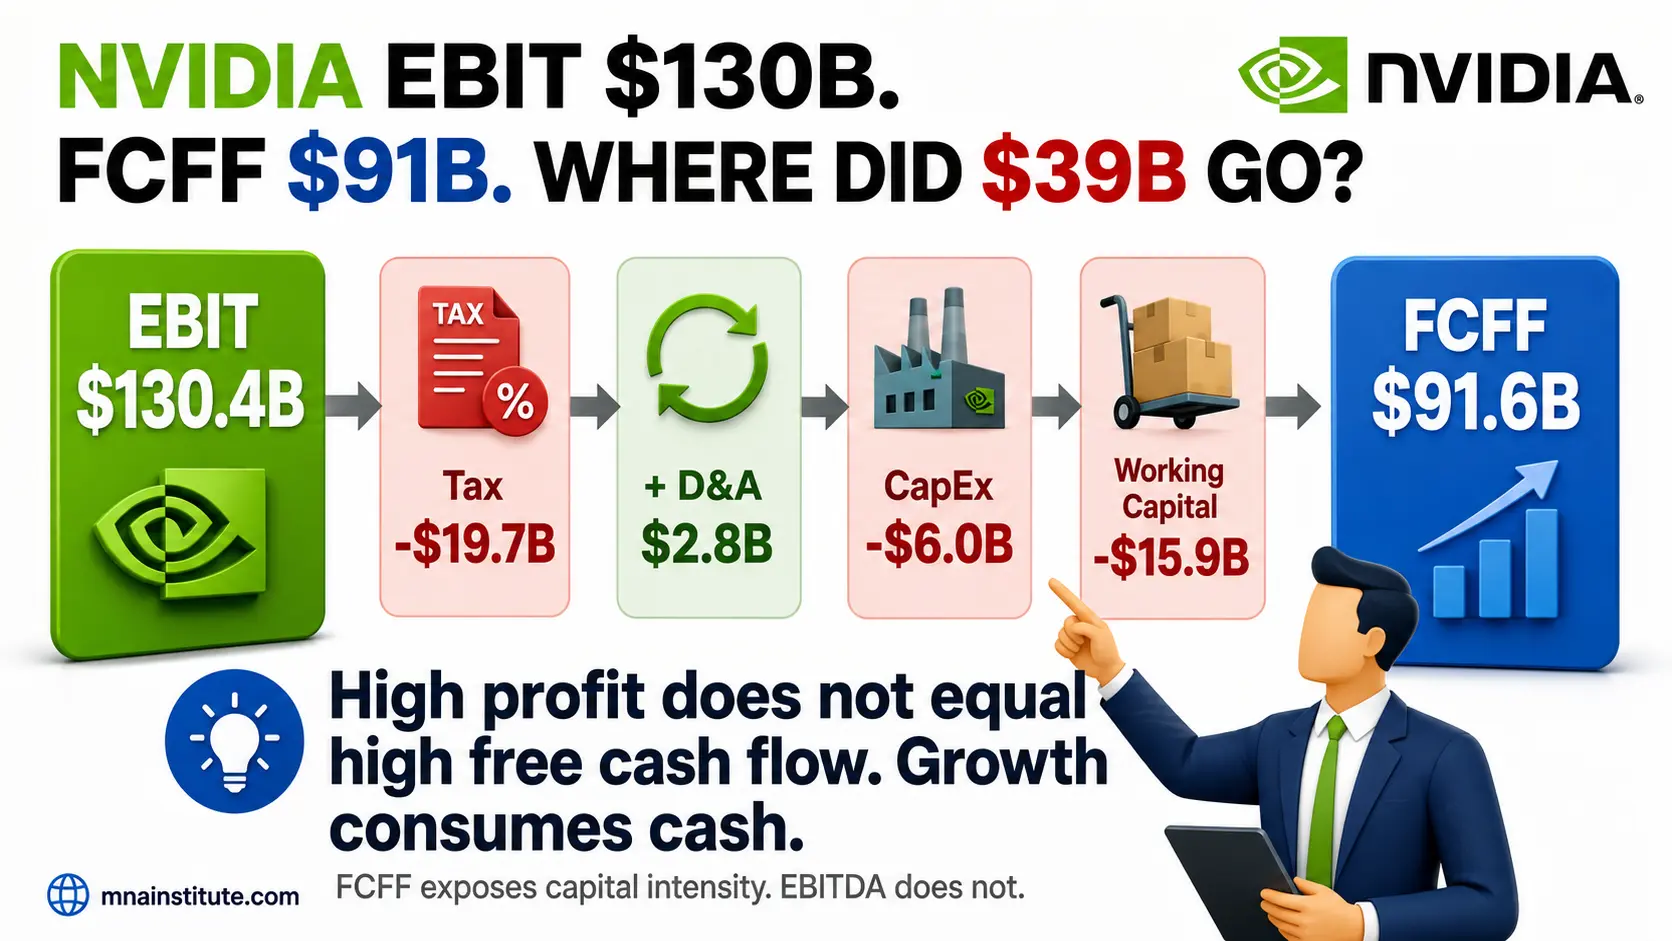
NVIDIA’s FY2026 EBIT was $130,387 million, representing an operating margin of 60.4 percent in the case material.
The next step is to apply the 15.1 percent effective tax rate.
After tax, NOPLAT comes to approximately $110,699 million.
NOPLAT represents after-tax operating profit before reinvestment.
Then D&A of $2,843 million is added back because depreciation and amortisation reduced EBIT but did not consume cash during the period.
CapEx of $6,042 million is subtracted because it represents cash invested in long-term operating assets.
Working capital consumed $15,949 million because rapid growth required more operating funding.
The result is FCFF of approximately $91,551 million.
That means the NVIDIA FY2026 FCFF margin in the course example is about 42 percent.
The calculation can be shown as follows.
FCFF = EBIT × (1 − t) + D&A − CapEx − ΔNWC
FCFF = $130,387 million × (1 − 15.1%) + $2,843 million − $6,042 million − $15,949 million
FCFF = approximately $91,551 million
|
FCFF calculation item |
Amount |
Interpretation |
|
EBIT |
$130,387 million |
Operating profit before financing costs |
|
Less operating tax |
15.1% effective tax rate |
Converts EBIT into NOPLAT |
|
NOPLAT |
$110,699 million |
After-tax operating profit |
|
Add D&A |
$2,843 million |
Non-cash expense added back |
|
Less CapEx |
$6,042 million |
Cash reinvested in long-term assets |
|
Less change in NWC |
$15,949 million |
Cash consumed by working capital growth |
|
FCFF |
$91,551 million |
Cash available to debt and equity capital providers |
This FCFF calculation shows why operating profit alone is not enough.
The company generated very high EBIT, but the analyst still needs to account for taxes, CapEx, and working capital before reaching valuation cash flow.
The difference between EBIT and free cash flow to the firm reveals how much of the reported operating profit must be reinvested to support the business.
In NVIDIA’s case, the conversion remains strong in the course example because margins are high and CapEx is small relative to operating profit.
Even so, working capital absorption is meaningful because rapid growth can require cash before customers pay or before inventory normalizes.
That is exactly the type of insight the FCFF formula is designed to reveal.

Why Effective Tax Rate Matters in the FCFF Formula
A common mistake in how to calculate FCFF is using a tax rate mechanically without understanding what it represents.
The statutory tax rate is the legal headline rate in a jurisdiction.
The effective tax rate reflects what the company actually paid relative to pre-tax income in the reported period.
For historical FCFF calculation, the effective tax rate often provides a practical starting point because it reflects the company’s actual tax profile.
For long-term forecasting, however, the analyst should decide whether the current effective tax rate is sustainable.
A low effective tax rate may result from tax credits, geographic income mix, stock-based compensation benefits, or temporary items.
If these items fade, using the current tax rate forever can overstate free cash flow to the firm.
If the tax profile is structurally low because of where the company earns income, the current effective tax rate may remain more relevant.
The FCFF formula itself does not answer that judgment question.
The analyst must understand the source of the tax rate before projecting future FCFF.

Why CapEx and Working Capital Separate Profit from Cash
The biggest conceptual jump in FCFF meaning is the difference between profit and cash available to capital providers.
CapEx is the first major separator.
A company can report strong operating profit because depreciation spreads past investment across many years.
But if the company must spend cash today to expand manufacturing capacity, data center infrastructure, logistics capability, or software systems, that cash is not available to investors.
The FCFF formula subtracts CapEx because valuation must reflect actual reinvestment needs.
Working capital is the second major separator.
When accounts receivable increase, the income statement may recognize revenue before cash is collected.
When inventory increases, the company has cash tied up in products or components that have not yet converted into sales.
When payables increase, suppliers may temporarily finance part of the operating cycle.
The change in net working capital measures the net cash effect of those operating balances.
This is why how to calculate FCFF requires linking the income statement, balance sheet, and cash flow statement together.
A single statement cannot explain FCFF on its own.
The income statement gives EBIT.
The cash flow statement gives D&A and CapEx.
The balance sheet and working capital schedule explain changes in receivables, inventory, and payables.
A clean FCFF calculation is therefore a three-statement exercise, not just a formula typed into Excel.
How FCFF Connects to Enterprise Value
Free cash flow to the firm is the cash flow used to value the operating assets of the entire firm.
That is why future FCFF is discounted at WACC.
WACC blends the required return of equity and after-tax cost of debt according to the company’s capital structure.
The resulting present value is enterprise value, because it represents the value available to all providers of capital.
This link is simple but often misunderstood.
If you use FCFF, you are valuing the firm before the split between creditors and shareholders.
If you want equity value, you then subtract net debt and other senior claims from enterprise value.
This is different from free cash flow to equity, which is after debt service and can be discounted at the cost of equity to estimate equity value directly.
In most corporate valuation work, FCFF is preferred because it keeps operating performance separate from financing policy.
That matters in M&A, investment banking, equity research, and corporate finance because capital structure may change after a transaction.
An acquirer may refinance debt after closing.
A private equity sponsor may add leverage.
A public company may repurchase shares or issue debt later.
The operating business should be valued before those financing decisions distort the cash flow.
Common Mistakes When Analysts Calculate FCFF
- Mistake 1: Treating EBITDA as if it were FCFF.
- EBITDA ignores tax, CapEx, and working capital, so it is not the same as free cash flow to the firm.
- Mistake 2: Adding back D&A but forgetting CapEx.
- D&A is non-cash, but the asset base still requires real cash reinvestment.
- Mistake 3: Ignoring working capital in a fast-growing company.
- Growth can consume cash through receivables and inventory even when reported revenue is rising.
- Mistake 4: Using statutory tax rate without checking the actual effective tax rate.
- Historical FCFF calculation should explain what tax rate is being used and why.
- Mistake 5: Mixing FCFF with equity cash flow logic.
- FCFF is before financing, so interest expense is not subtracted in the standard EBIT-based FCFF formula.
- Mistake 6: Calculating one historical year without asking whether it is normalized.
- A single year may include unusual working capital movement, catch-up CapEx, or temporary margin effects.
- Mistake 7: Forgetting the valuation output.
- FCFF discounted at WACC gives enterprise value, not equity value directly.

A Practical Analyst Workflow for FCFF Calculation
A reliable FCFF calculation works best when built in a fixed sequence.
First, read the business context so you understand what drives revenue, margins, capital intensity, and working capital needs.
Second, pull EBIT from the income statement and check whether it includes unusual operating items.
Third, apply a tax rate that reflects operating tax burden and can be explained to an investment committee.
Fourth, pull D&A from the cash flow statement or supporting schedule and confirm whether it is consistent with the asset base.
Fifth, pull CapEx from the investing section of the cash flow statement and separate maintenance logic from growth investment where possible.
Related Courses
The following courses are related to the financial modeling and valuation workflow discussed in this article.
- Financial Modeling and Valuation Course with AI and Excel
- Financial Modeling Course with AI for Equity Research
- 3-Statement Financial Modeling Course with AI
- Mergers and Acquisitions Online Course
- M&A Due Diligence Course
- Post Merger Integration Course
Sources
- CFA Institute – Free Cash Flow Valuation
- NVIDIA – Fourth Quarter and Fiscal 2026 Financial Results
- Aswath Damodaran – The Free Cashflow to Firm Model
- Investopedia – Free Cash Flow to the Firm