EBITDA Calculation: Formula, EBIT vs EBITDA Explained
An income statement is not one profit number.
It is a sequence of profit subtotals that tells an analyst where value is created, where cost pressure enters, and which earnings figure can be used for valuation.
A clean EBITDA calculation begins long before the EBITDA line itself, because each subtotal between revenue and net income carries a different analytical meaning.
Gross profit tests product economics.
Operating income tests the core business after overhead.
EBIT removes financing and tax structure from the picture.
Net income shows what remains for shareholders after every deduction.
EBITDA then adds back depreciation and amortization to create a more comparable operating earnings measure.
The challenge is that EBITDA is useful only when the analyst understands what it excludes.
Microsoft fiscal year 2025 provides a practical example because the company reported revenue of about $282 billion, operating income of about $129 billion, net income of about $102 billion, and depreciation and amortization of about $34 billion.
Those numbers let us move step by step from gross profit to EBITDA without treating the formula as a shortcut.
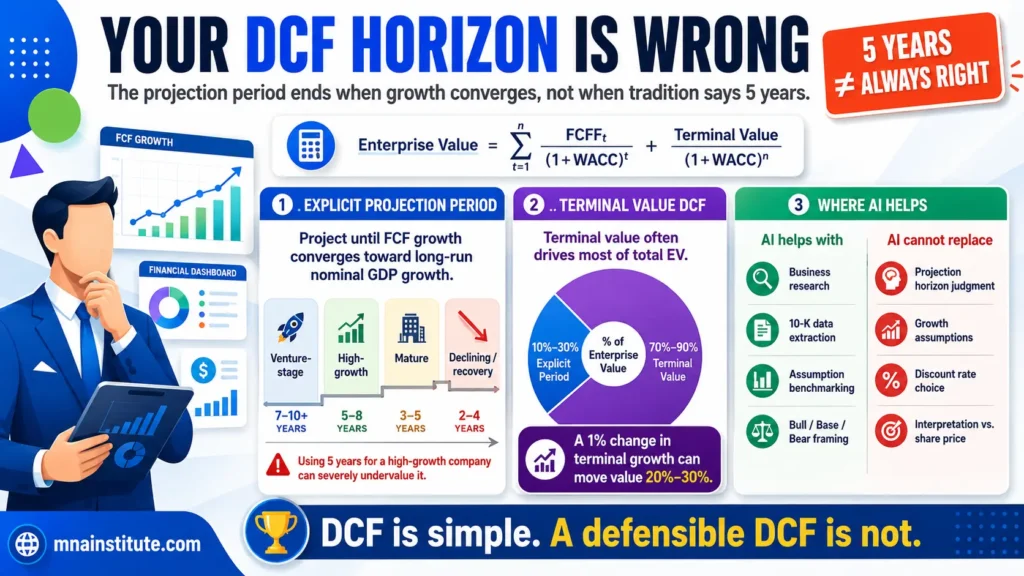
The purpose of this article is to show EBITDA how to calculate it, why EBIT vs EBITDA matters, and when adjusted EBITDA is necessary before applying a valuation multiple.
Profit Bridge in One View
|
Stage |
Formula or movement |
Analytical question |
|
Gross Profit |
Revenue – Cost of Revenue |
Does the product or service create margin before overhead? |
|
Operating Income |
Gross Profit – Operating Expenses |
What does the core business earn before financing and tax? |
|
Pre-tax Income |
Operating Income + Non-operating Items |
What remains before tax after financing and investing effects? |
|
Net Income |
Pre-tax Income – Income Tax Expense |
What profit remains for shareholders? |
|
EBITDA |
Operating Income + Depreciation + Amortization |
What is operating earnings before non-cash D&A charges? |
|
Adjusted EBITDA |
EBITDA +/- Normalization Adjustments |
What recurring earnings base should support valuation? |

Gross Profit Shows Whether the Product Economics Work
The first step toward EBITDA calculation is understanding gross profit.
Gross profit is the amount left after subtracting the direct cost of producing or delivering the product or service.
Gross Profit = Revenue – Cost of Revenue
Cost of revenue is the direct economic cost attached to revenue generation.
For a manufacturer, it usually includes raw materials, factory labor, production overhead, equipment depreciation, and quality control cost.
For a retailer, it is mainly the wholesale cost of goods purchased for resale.
For a software or cloud company, cost of revenue includes data center operations, server infrastructure, technical support, royalties, traffic acquisition, and service delivery personnel.
Gross profit therefore tells you whether the business model can generate margin before corporate overhead enters the analysis.
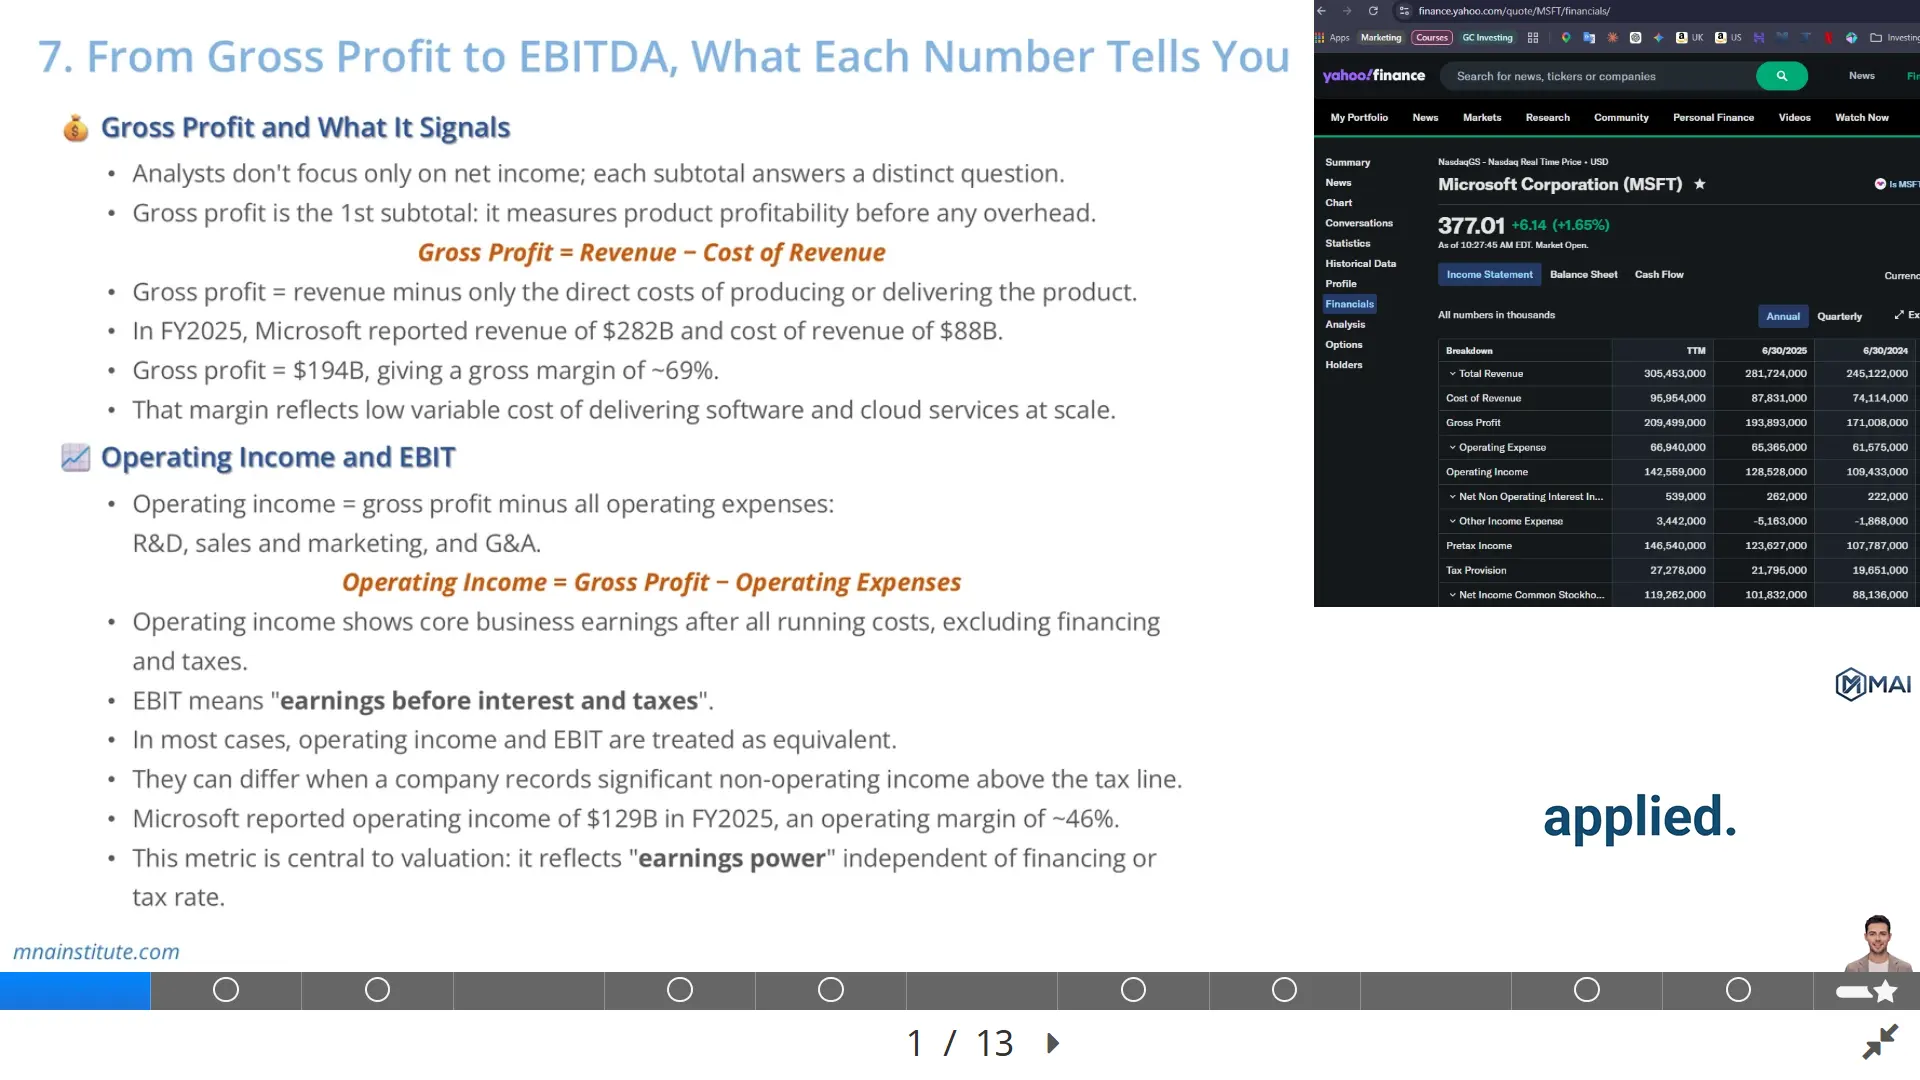
Microsoft reported fiscal year 2025 revenue of $281.724 billion and cost of revenue of $87.831 billion.
That produces gross profit of $193.893 billion, which rounds to $194 billion.
Gross Margin = Gross Profit / Revenue
$193.893B / $281.724B = 68.8%
A 68.8% gross margin tells the analyst that Microsoft earns a large spread between revenue and direct delivery cost.
That spread reflects the economics of software licensing, cloud platforms, subscription services, and scale benefits across a global customer base.
Gross profit does not tell you whether the company is cheap or expensive.
It tells you whether the product layer of the income statement has enough margin to support the operating structure below it.
A low gross margin business may still create value, but it needs disciplined overhead and strong working capital control.
A high gross margin business can absorb heavy research, sales, and platform investment, but only if those expenses are producing durable growth.
This is why an analyst should not jump directly from revenue to EBITDA.
The gross profit layer explains how much economic room the business has before overhead is deducted.
That makes gross profit the first checkpoint in a serious EBITDA calculation.

Operating Income and EBIT Show Core Earnings Power
The next step in the EBITDA calculation bridge is operating income.
Operating income starts with gross profit and subtracts operating expenses required to run the business.
Operating Income = Gross Profit – Operating Expenses
Operating expenses normally include research and development, sales and marketing, and general and administrative costs.
Research and development represents the cost of building future products, maintaining technology capability, and sustaining competitive position.
Sales and marketing represents the cost of acquiring customers, supporting channels, running advertising, and maintaining enterprise sales coverage.
General and administrative expense covers finance, legal, human resources, executive leadership, compliance, and other corporate functions.
Microsoft reported operating expenses of $65.365 billion in fiscal year 2025.
Subtracting those operating expenses from gross profit of $193.893 billion produces operating income of $128.528 billion.
$193.893B – $65.365B = $128.528B
That operating income figure rounds to $129 billion and produces an operating margin of about 45.6%.
Operating Margin = Operating Income / Revenue
$128.528B / $281.724B = 45.6%
EBIT stands for Earnings Before Interest and Taxes.
In many company analyses, operating income and EBIT are treated as close equivalents.
That treatment is practical when the income statement does not include large recurring non-operating income above the tax line.
The distinction still matters.
Operating income is normally a reported GAAP line showing profit from operations.
EBIT is an analytical measure that can include operating income plus or minus certain non-operating items, depending on the analyst’s definition.
For Microsoft, the valuation analysis can start from operating income because the core business profitability is clearly separated from financing and tax effects.
That is the reason EBIT vs EBITDA is not only a terminology issue.
EBIT captures earnings before interest and tax, while EBITDA adds back depreciation and amortization on top of that operating earnings base.
A reliable EBITDA calculation therefore begins by defining EBIT consistently.
Non-Operating Items Explain the Gap Between EBIT and Pre-tax Income
After operating income, the income statement moves into items that do not arise directly from running the core business.
These are usually classified as interest income, interest expense, investment gains, investment losses, and other income or expense.
They matter because they help explain why operating income does not always equal pre-tax income.
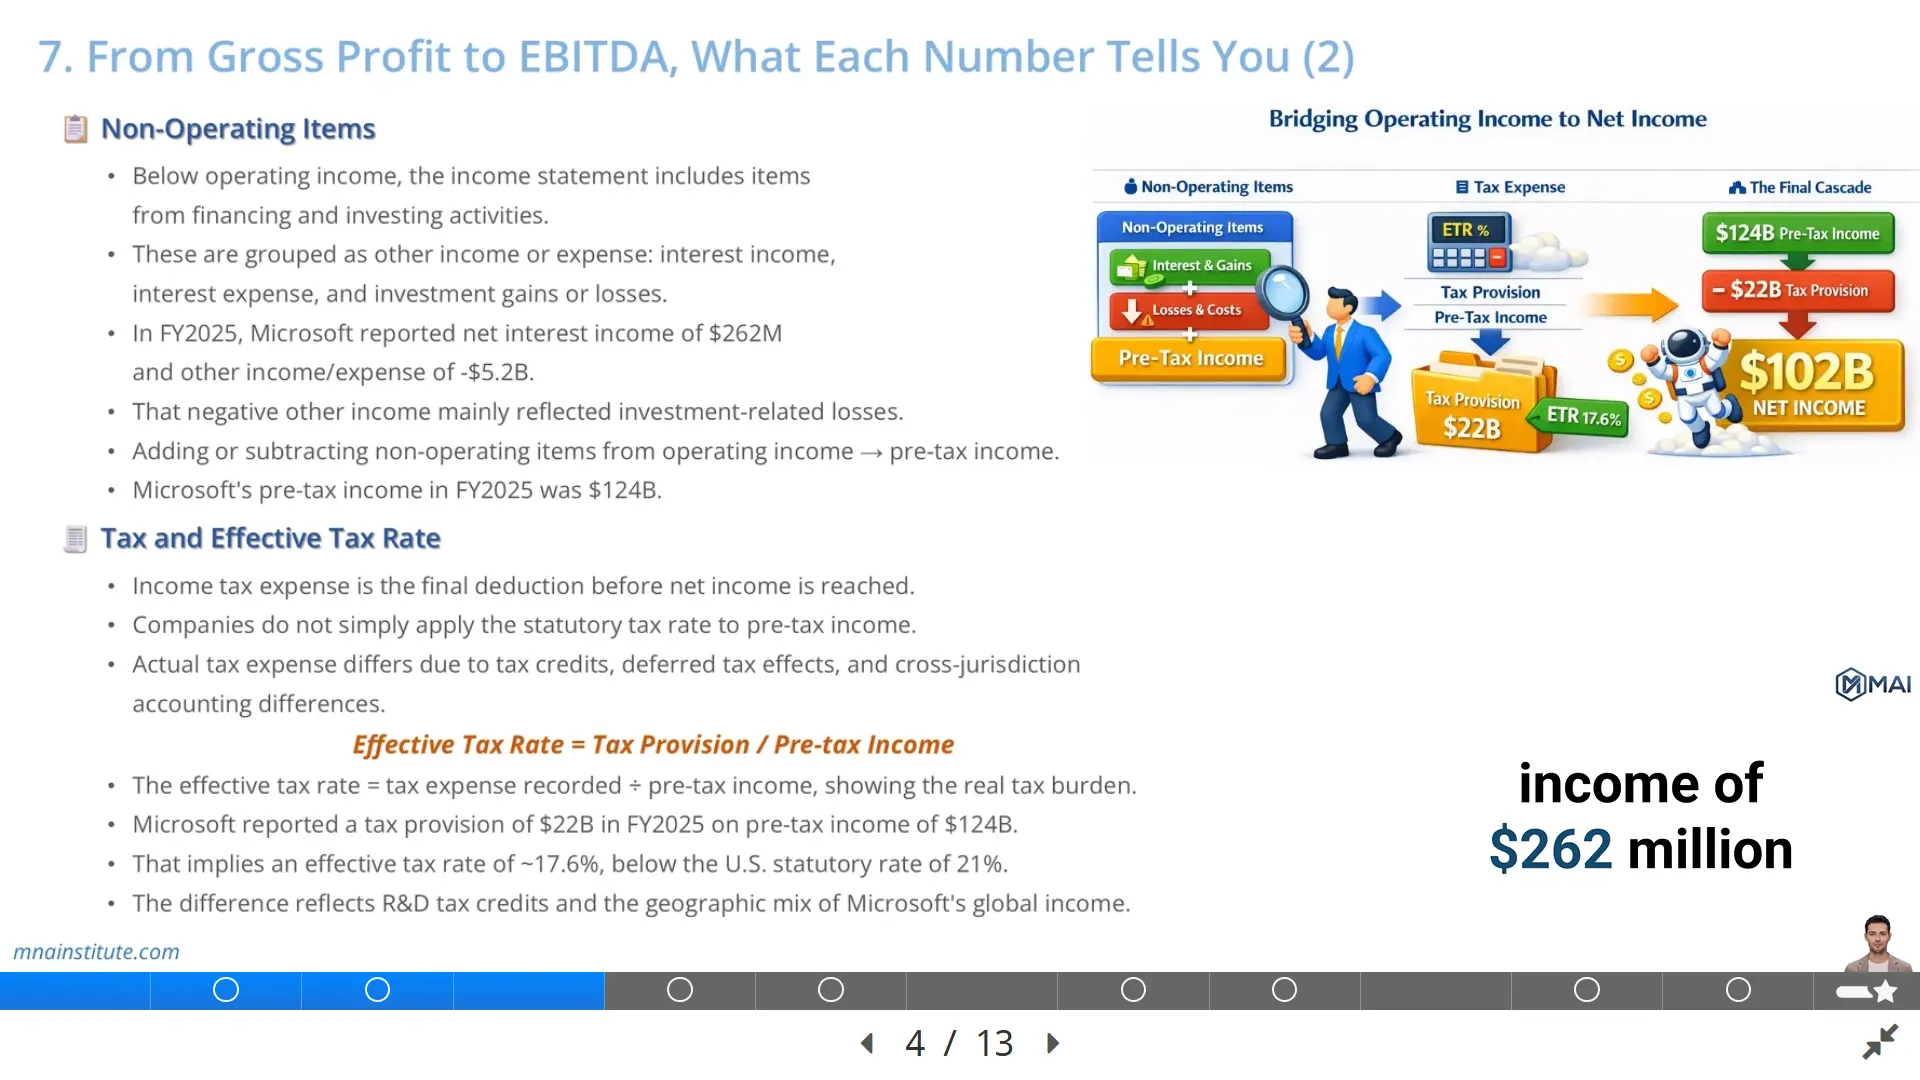
Microsoft reported net interest income of about $262 million in fiscal year 2025.
It also reported other income and expense of negative $5.2 billion, driven mainly by investment-related losses in that period.
When these items are added to operating income, the result is income before income taxes.
Pre-tax Income = Operating Income + Non-operating Items
Microsoft reported pre-tax income of about $124 billion in fiscal year 2025.
An analyst should separate this layer carefully because non-operating items can distort the earnings base used for valuation.
A one-time gain from selling an investment can inflate pre-tax income even if the operating business did not improve.
A one-time investment loss can depress pre-tax income even if the operating business remains strong.
This is why EBITDA calculation normally starts from operating income rather than from reported net income for a company like Microsoft.
Starting from operating income keeps the focus on the business before financing, investment marks, and tax structure.
If an analyst starts from net income, the formula must add back interest and taxes first, then add back depreciation and amortization.
EBITDA = Net Income + Interest + Taxes + Depreciation + Amortization
Both paths can work if the same economics are captured consistently.
The operating income path is usually cleaner when operating income is clearly reported and depreciation and amortization can be sourced from the cash flow statement or footnotes.
That is why the EBITDA calculation should document the starting point before any add-back is made.

Tax and Effective Tax Rate Show the Real Tax Burden
Income tax expense is the final deduction before net income.
Companies do not simply multiply pre-tax income by the headline statutory tax rate.
The actual tax provision reflects jurisdictional mix, tax credits, deferred tax effects, and differences between accounting income and taxable income.
Effective Tax Rate = Tax Provision / Pre-tax Income
Microsoft reported tax provision of about $22 billion on pre-tax income of about $124 billion in fiscal year 2025.
$22B / $124B = 17.6%
That 17.6% effective tax rate is below the U.S. federal statutory corporate tax rate of 21%.
The difference reflects factors such as research and development tax credits and the geographic mix of income.
For EBITDA calculation, tax is intentionally excluded.
EBITDA is before taxes because tax expense depends on legal structure, geography, historical tax attributes, and accounting rules.
Two companies with similar operating economics can show different tax expense due to jurisdictional mix or deferred tax positions.
A valuation multiple based on EBITDA tries to compare operating earnings before that tax layer.
That does not mean tax is irrelevant.
Tax matters heavily in DCF valuation, free cash flow analysis, and after-tax return calculations.
The point is narrower.
EBITDA removes taxes so the analyst can compare operating performance before financing and tax architecture.
A disciplined analyst therefore knows where the tax line belongs.
It is excluded from EBITDA, but it must return when converting earnings into free cash flow or estimating after-tax operating profit.
A clean EBITDA calculation isolates the tax line without pretending that taxes disappear from valuation.

Net Income Is Final Profit, but Not Always Sustainable Earnings
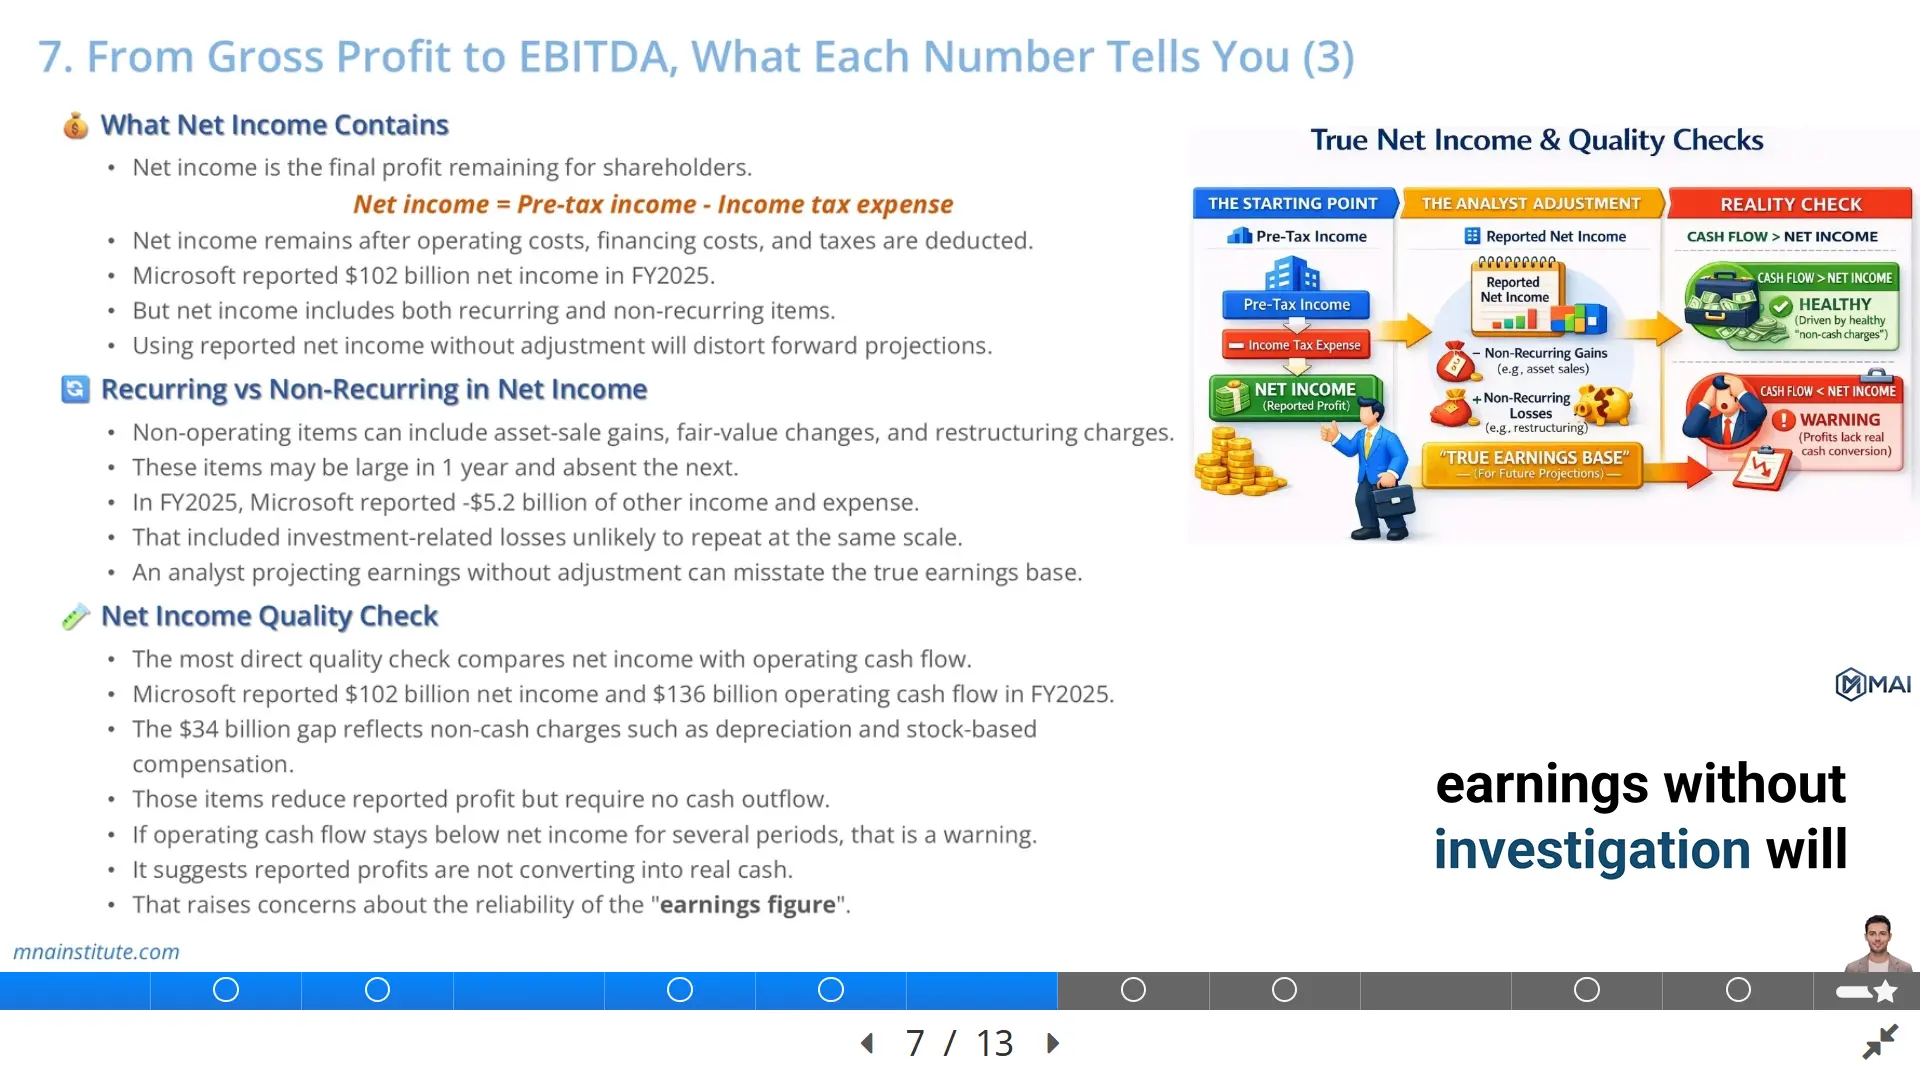
Net income is the bottom-line profit available to common shareholders after all expenses, non-operating items, financing costs, and taxes are reflected.
Net Income = Pre-tax Income – Income Tax Expense
Microsoft reported net income of $101.832 billion in fiscal year 2025.
That figure is economically meaningful because it captures the full earnings result for the period.
It is also the starting point for earnings per share and many equity market metrics.
However, net income is not automatically a clean forecast base.
It can include recurring operating earnings, non-recurring investment losses, litigation costs, restructuring charges, gains on asset sales, and other items that may not repeat.
Microsoft recorded negative other income and expense of about $5.2 billion in fiscal year 2025.
An analyst building a forward model should ask whether that amount reflects ongoing business economics or a period-specific item.
If it is unlikely to recur at the same scale, the forward earnings base should not mechanically carry it into future periods.
This is the logic behind normalized earnings.
The same logic applies to adjusted EBITDA.
Reported net income is an accounting result for the period.
Normalized earnings are an analytical estimate of recurring earnings capacity.
The difference matters in valuation because investors pay for future earnings, not for every line item that happened to pass through the current-year income statement.
A company can report strong net income while the cash flow statement tells a weaker story.
A company can also report depressed net income while operating cash flow remains strong due to non-cash or non-recurring deductions.
The analyst must read net income against cash flow and disclosures before deciding how much of it belongs in a forward valuation model.
This step protects the EBITDA calculation from inheriting one-year noise from net income.

Net Income Quality Check Connects Profit to Cash
The most direct quality check is to compare net income with operating cash flow across several periods.
The income statement uses accrual accounting, so revenue and expenses are recorded when earned or incurred, not only when cash moves.
The cash flow statement reconciles net income to cash generated by operating activities.
This reconciliation reveals whether reported profit is supported by actual cash generation.
Microsoft reported fiscal year 2025 net income of $101.832 billion and depreciation, amortization, and other of $34.153 billion in the operating cash flow reconciliation.
It also reported stock-based compensation expense of $11.974 billion.
These non-cash expenses reduce reported profit but do not require cash to leave the company in the same period.
That is one reason operating cash flow can exceed net income for a highly profitable software and cloud business.
The key analytical question is not whether net income and operating cash flow are identical.
They almost never are.
The question is whether the difference can be explained by normal working capital movement, non-cash charges, and disclosed accounting items.
For EBITDA calculation, depreciation and amortization are especially relevant because they are the two non-cash charges added back to operating income.
This does not make EBITDA equal to cash flow.
EBITDA does not subtract capital expenditure.
EBITDA does not capture working capital investment.
EBITDA does not reflect cash taxes or cash interest.
That limitation is why EBITDA is useful as a comparability metric but dangerous when treated as a substitute for free cash flow.
A strong analyst uses EBITDA to understand earnings capacity and then uses the cash flow statement to test whether that capacity becomes cash.
That is the practical boundary around EBITDA calculation in financial statement analysis.

EBITDA Calculation Adds Back Depreciation and Amortization
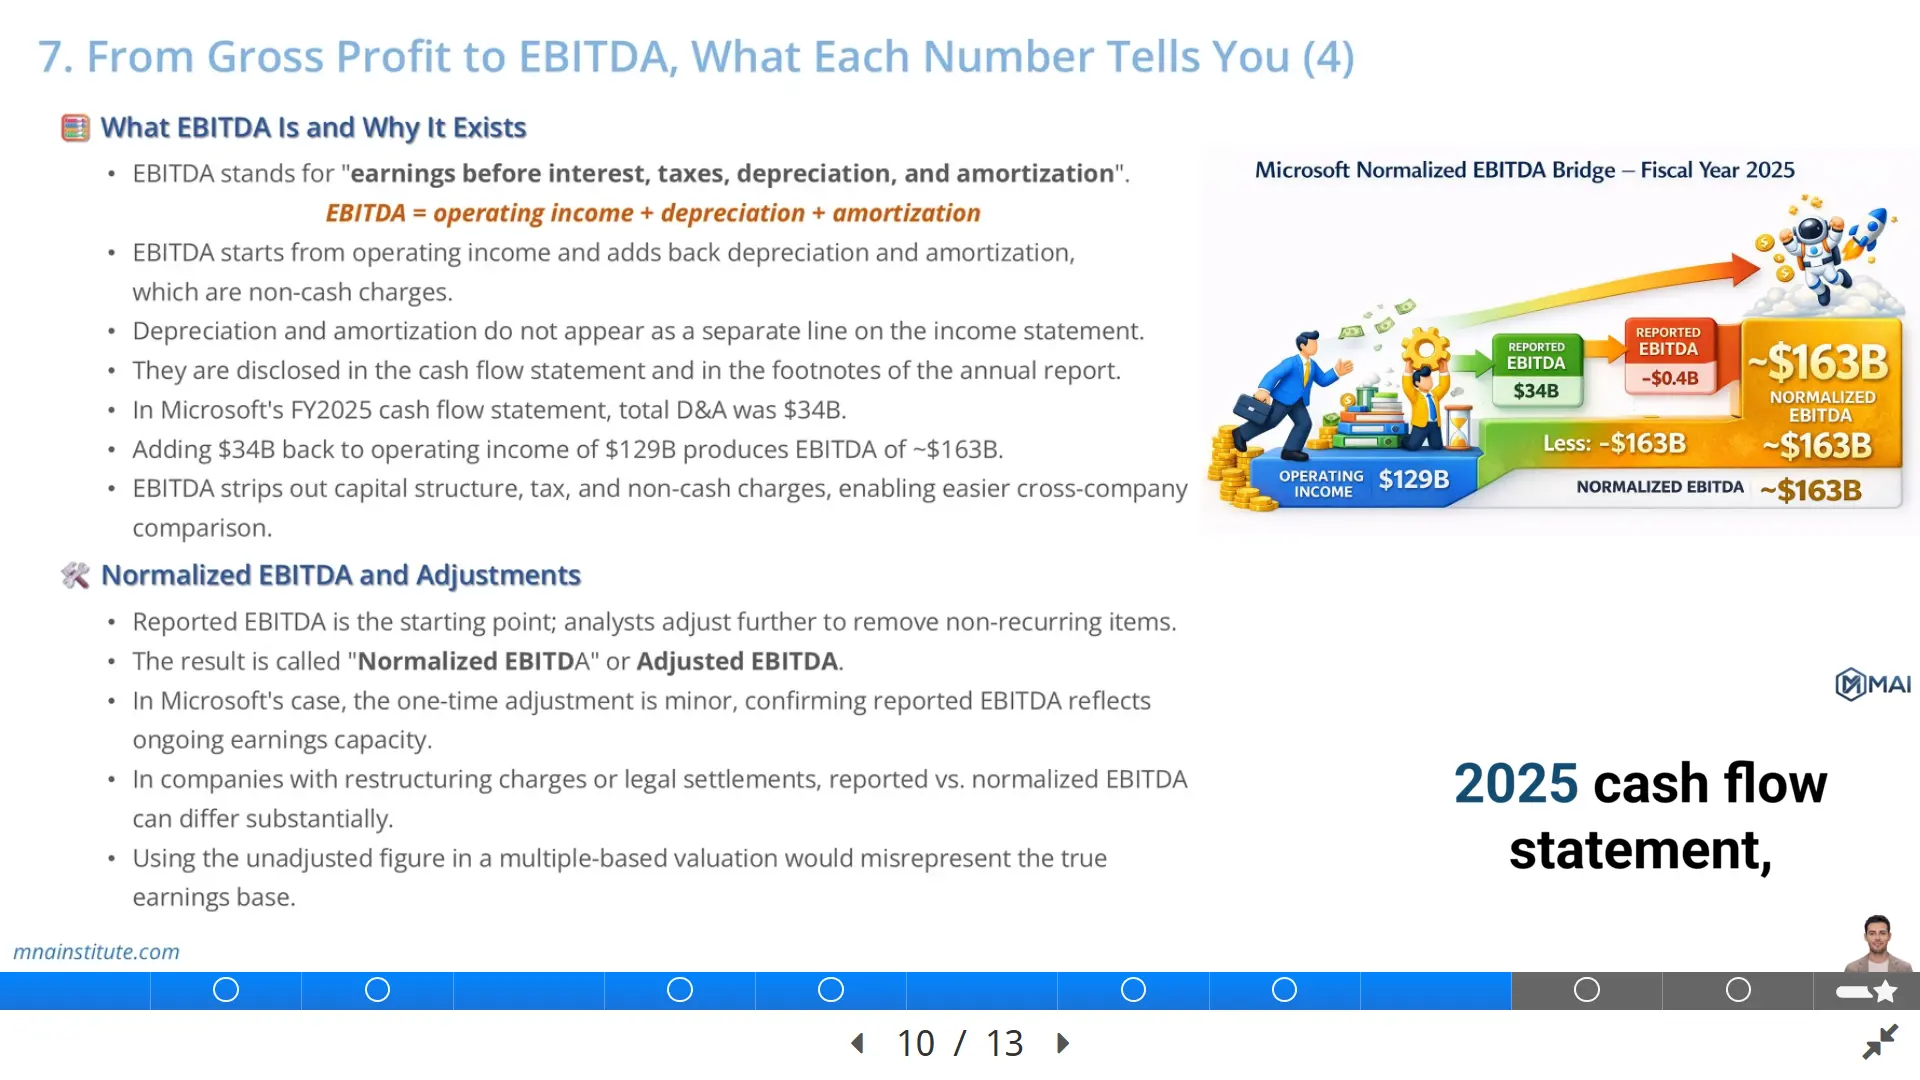
EBITDA stands for Earnings Before Interest, Taxes, Depreciation, and Amortization.
The clean operating-income version of the EBITDA formula is simple.
The EBITDA formula is simple only if the analyst knows exactly where the add-backs come from.
EBITDA = Operating Income + Depreciation + Amortization
The formula adds back depreciation and amortization because those charges reduce accounting profit without creating a current-period cash outflow.
Depreciation allocates the cost of physical assets over their useful lives.
Amortization allocates the cost of intangible assets over their useful lives.
Neither line normally appears as a standalone line on the face of the income statement.
They are usually embedded inside cost of revenue and operating expense categories.
The analyst must source them from the cash flow statement or footnotes.
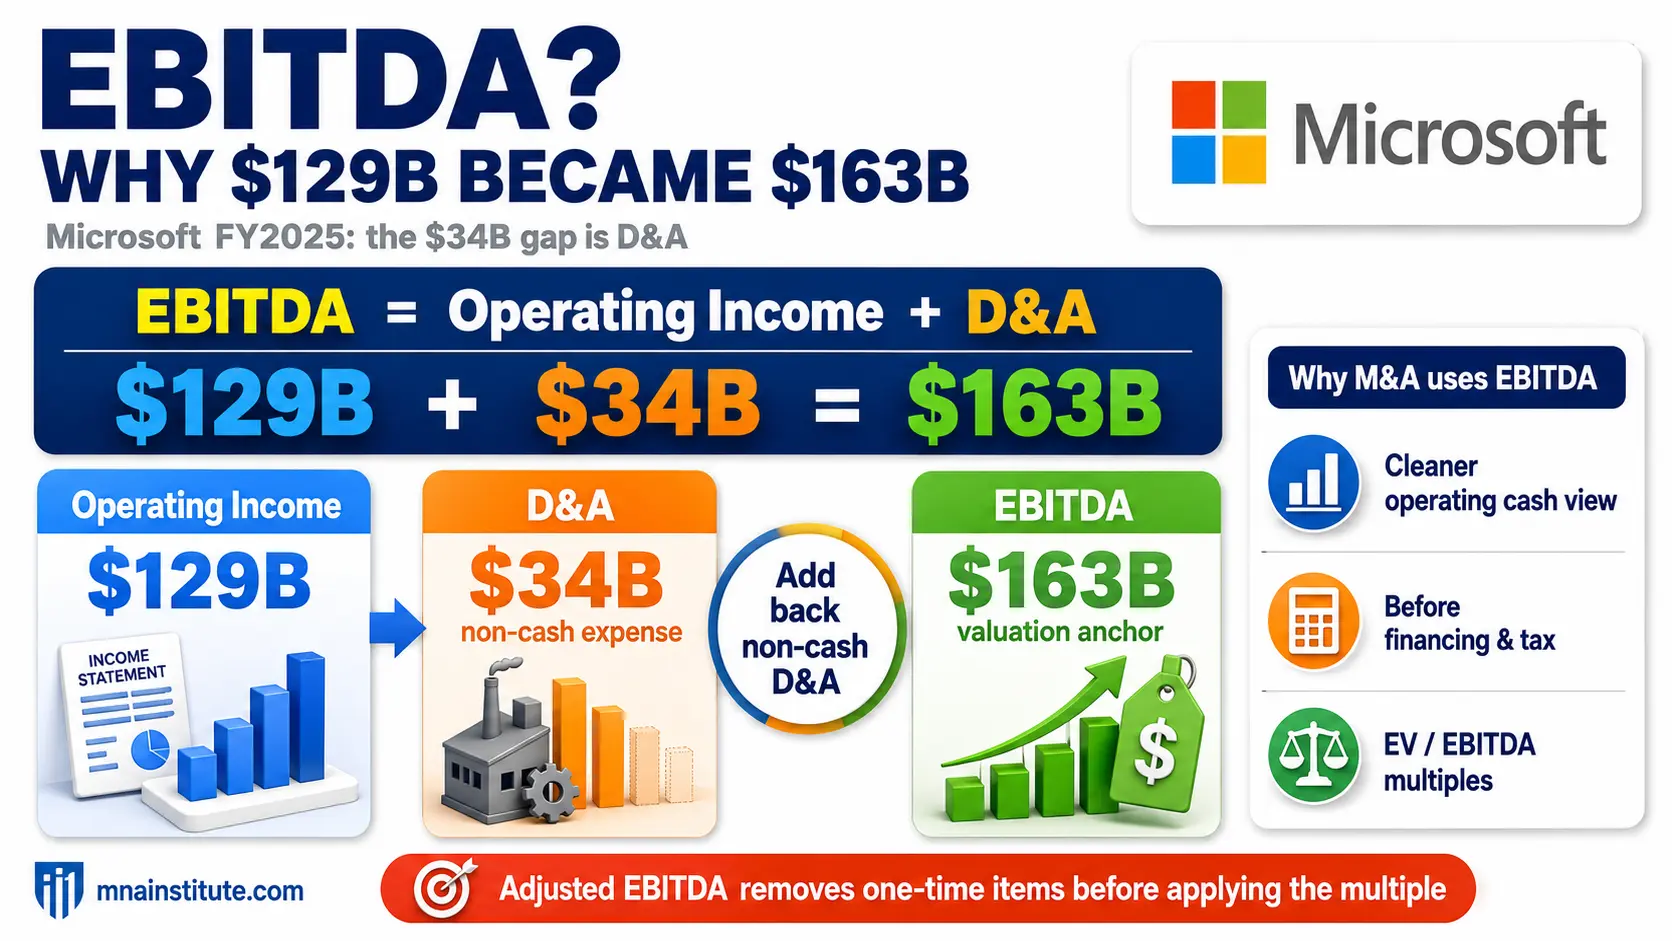
Microsoft reported depreciation, amortization, and other of $34.153 billion in fiscal year 2025.
Adding that amount to operating income of $128.528 billion produces EBITDA of about $162.681 billion.
$128.528B + $34.153B = $162.681B
Rounded, Microsoft fiscal year 2025 EBITDA is about $163 billion.
This is the practical answer to EBITDA how to calculate for a public company with clear operating income and cash flow disclosure.
The analyst starts with operating income, finds depreciation and amortization in the cash flow statement, and adds the amount back.
That is the EBITDA calculation investors usually expect when operating income is available.
EBIT vs EBITDA becomes clear at this point.
EBIT is operating earnings before interest and tax.
EBITDA is EBIT before depreciation and amortization as well.
For asset-light software businesses, the gap may be moderate relative to revenue.
For data center, telecom, industrial, airline, and infrastructure businesses, the gap can be large because depreciation reflects heavy capital investment.
The EBITDA calculation then becomes especially sensitive to whether depreciation reflects maintenance assets or growth assets.

Adjusted EBITDA Normalizes Earnings Before Valuation Multiples
Reported EBITDA is not always the number an analyst should use in a valuation multiple.
The next step is to determine whether any non-recurring or non-operating items should be removed.
That process produces normalized EBITDA or adjusted EBITDA.
Adjusted EBITDA = EBITDA +/- Normalization Adjustments
The adjustments should be specific, documented, and tied to items that do not represent ongoing earnings capacity.
Common adjustments include restructuring costs, litigation settlements, acquisition-related transaction costs, owner compensation adjustments in private companies, discontinued operations, and one-time asset sale gains or losses.
The goal is not to make the company look better.
The goal is to measure sustainable earnings before applying an EBITDA multiple.
For Microsoft fiscal year 2025, the EBITDA bridge is straightforward.
|
Line Item |
Amount |
|
Operating Income |
$128.528B |
|
Add: Depreciation, amortization, and other |
$34.153B |
|
Reported EBITDA |
$162.681B |
|
Illustrative normalization adjustment |
Minor in this case |
|
Normalized EBITDA |
Approximately $163B |
In this example, reported EBITDA and normalized EBITDA are close because the adjustment does not change the earnings base materially.
In other companies, adjusted EBITDA can differ sharply from reported EBITDA.
A company with repeated restructuring charges may describe those charges as non-recurring, but repeated charges become part of the business pattern.
A private company may add back owner compensation, but the analyst must estimate what a market-rate management team would actually cost.
A recently acquired company may add back transaction expenses, but integration costs may continue for several years.
This is why adjusted EBITDA is powerful but also judgment-heavy.
CFA-style valuation work treats enterprise value multiples such as EV/EBITDA as useful because they relate total enterprise value to a measure of business earnings before capital structure effects.
That usefulness depends on the quality of the denominator.
If EBITDA contains non-recurring noise, the multiple becomes misleading.
If EBITDA ignores capital intensity, the multiple may overstate value for businesses that require heavy reinvestment.
The analyst should therefore use EBITDA calculation as one layer in a broader valuation process, not as the final answer.
The best EBITDA calculation is not the biggest number, but the number that most honestly reflects recurring operating earnings.
Related Courses
This topic connects directly to practical valuation, income statement analysis, and financial modeling.
- The most relevant course is the Financial Modeling and Valuation Course with AI and Excel because EBITDA calculation feeds directly into valuation multiples, DCF checks, and earnings normalization, especially when analysts move from accounting profit to normalized operating earnings.
- The income statement bridge from gross profit to EBITDA is also a foundation for the Financial Statement Analysis Course with AI for Equity Research because analysts must interpret each subtotal before forecasting future performance.
- When analysts need to connect EBITDA to the full model, the 3-Statement Financial Modeling Course with AI shows how income statement items connect with working capital, CapEx, debt, tax, and cash flow.
- For transaction work, EBITDA adjustments also appear in diligence, pricing, and negotiation analysis within the Mergers and Acquisitions Online Course because buyers and sellers rarely agree on normalized earnings without evidence.
Sources
- Microsoft 2025 Annual Report: Summary results of operations, income statement data, segment results, and accounting notes.
- Microsoft FY2025 Q4 Cash Flows: Depreciation, amortization, stock-based compensation, net income, and operating cash flow reconciliation.
- SEC Beginners Guide to Financial Statements: Income statement and cash flow statement explanation for investors.
- CFA Institute Market-Based Valuation: Price and Enterprise Value Multiples: Enterprise value multiples and EV/EBITDA valuation context.