Claude Financial Analysis: 7 Checks for Reliable 10-K Data
A financial number can be accurately quoted and still use the wrong basis for your comparison. Use Claude to extract and calculate; keep the source, missing data and assumptions visible.
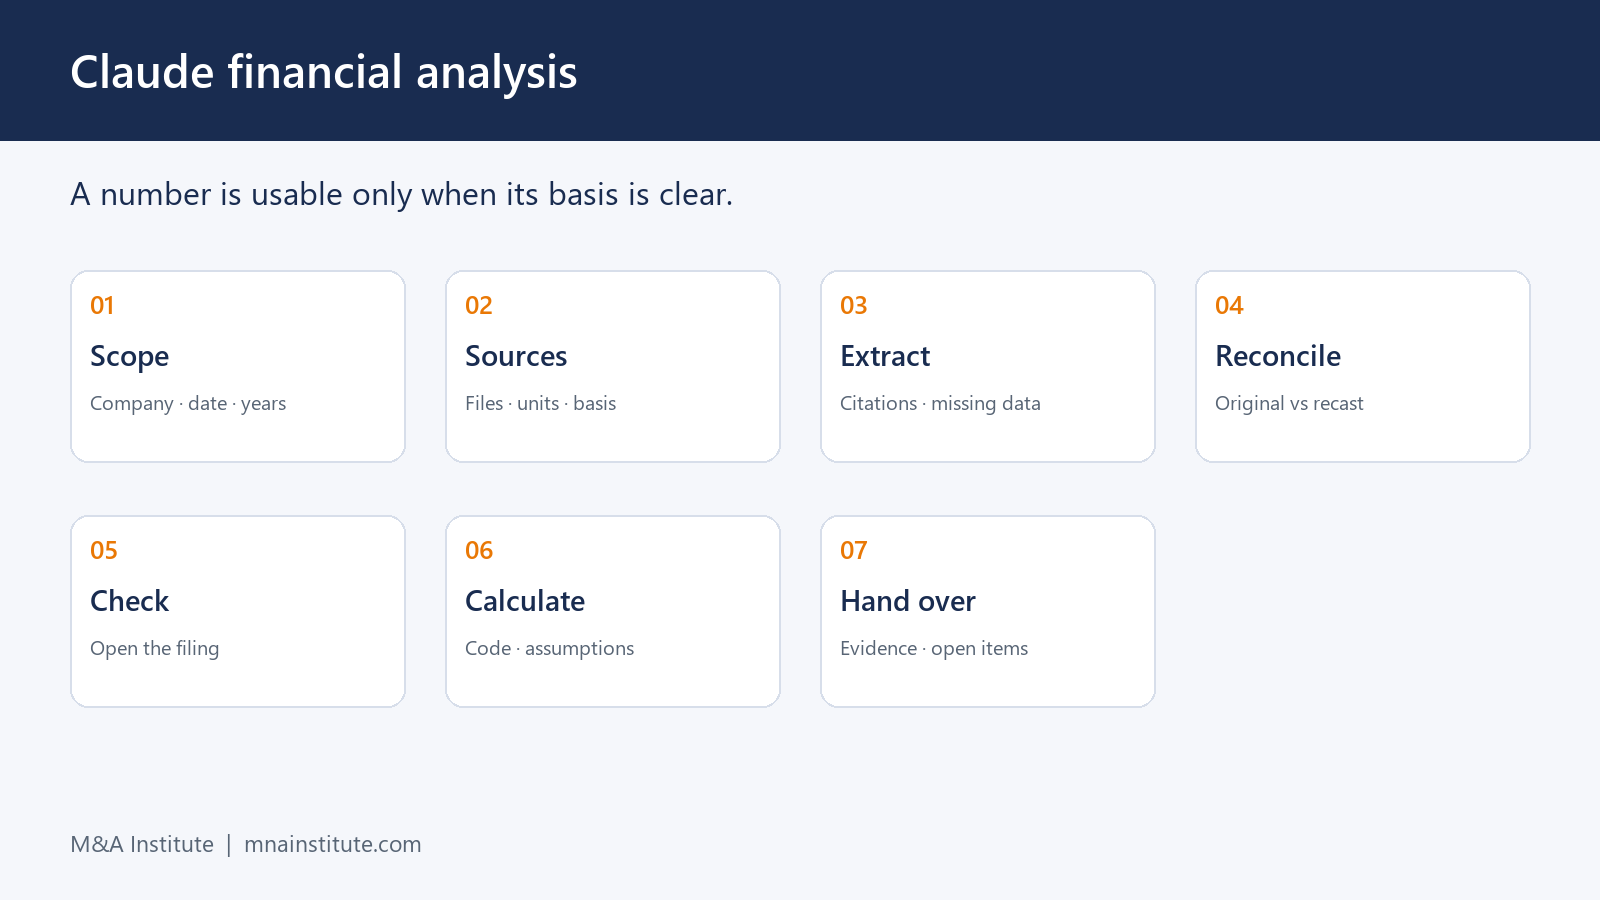
Claude financial analysis is useful when its output can be checked. This practical workflow follows the existing M&A Institute explanation video: set up the case, compare two companies’ financial data with their filings, and calculate an illustrative growth gap. Here are seven checks to make the result usable.
- Set the job before you start Claude financial analysis
- Set up a project for Claude financial analysis
- Ask for a sourced table, including the gaps
- Reconcile the reporting basis before calling a difference an error
- Open one number yourself, then extend the check
- Calculate a Claude financial analysis scenario with code
- Hand over the evidence with the result
Watch the 2:25 workflow
Claude financial analysis demonstration: historical Synopsys–Ansys case. Follow the source and calculation checks in the companion guide.
1. Set the job before you start Claude financial analysis
A useful analysis starts with a bounded assignment. In this example, the job is to build a comparable financial table for two companies, identify disagreements with their filings, and calculate a historical-growth scenario. This Claude financial analysis is the data preparation stage of an acquisition investment case. The first video does not deliver a complete financial model or an acquisition recommendation.
Write down the company names, announcement date, fiscal years, currency, unit and source documents before asking for numbers. “Five years before the deal” is a request for five annual observations. It does not mean five growth intervals. Nor does it mean that a current finance website still presents every company and every historical reporting basis.
The case uses Synopsys and Ansys filings and announcement materials. Treat it as a historical exercise. Keep the original documents used in the lesson, rather than silently replacing an old year with the latest available year. For your own Claude financial analysis, create a new source list and state the analysis date. A market-data page viewed today may differ from the one visible in the demonstration.
Keep the deliverables small enough to check: a source table, a list of unresolved differences, and a chart with its calculation method. Only after those outputs are checked should they feed a board memo or valuation. This makes the first exercise useful on its own and gives the next reviewer a clear starting point.
2. Set up a project for Claude financial analysis

The video uses a Claude project to keep the case documents and working instructions together. The four starting files are the two FY2023 annual reports, the deal announcement and the accompanying investor presentation. The annual reports support the financial comparison; the announcement materials establish the case context. Older filings may still be needed to complete the requested historical period.
For Claude financial analysis, project instructions should specify how to answer, rather than merely naming a job title. Set the currency and units, request a document and section for every figure, and require missing values to remain visible. These are the original working instructions used for the exercise:
You are the corporate development analyst on Synopsys's deal team. Report all figures in USD millions on a fiscal-year basis, cite the document and section behind every number, and answer 'not disclosed' when a figure is not in the files. Keep answers board-ready: lead with the conclusion, then the evidence.
A project helps reuse files and rules, but do not assume that every new chat automatically knows all the calculations from another chat. Keep related calculation work in a continuing conversation, or explicitly provide the checked table and previous result. Claude’s project guidance describes the distinction between project knowledge and chat context.
Feature access and screen labels can vary by plan and organisation. The lesson shows Claude; the practice guide also gives the corresponding ChatGPT route. Check which tools are available in your workspace before starting. This workflow uses public filings, so the learner can repeat the source check without uploading confidential deal-room materials.
3. Ask for a sourced table, including the gaps
The first Claude financial analysis prompt does more than request a summary. It identifies a source, fixes the time window, specifies a table and asks for a comparison against the filings. Those four choices make the output easier to audit. Here is the original prompt:
Open Yahoo Finance and collect annual revenue, operating income and free cash flow for Synopsys (SNPS) and Ansys (ANSS) for the five fiscal years before the deal. Put both companies in one table, add the growth rate for each year, and flag any figure that differs from the 10-K in this project.
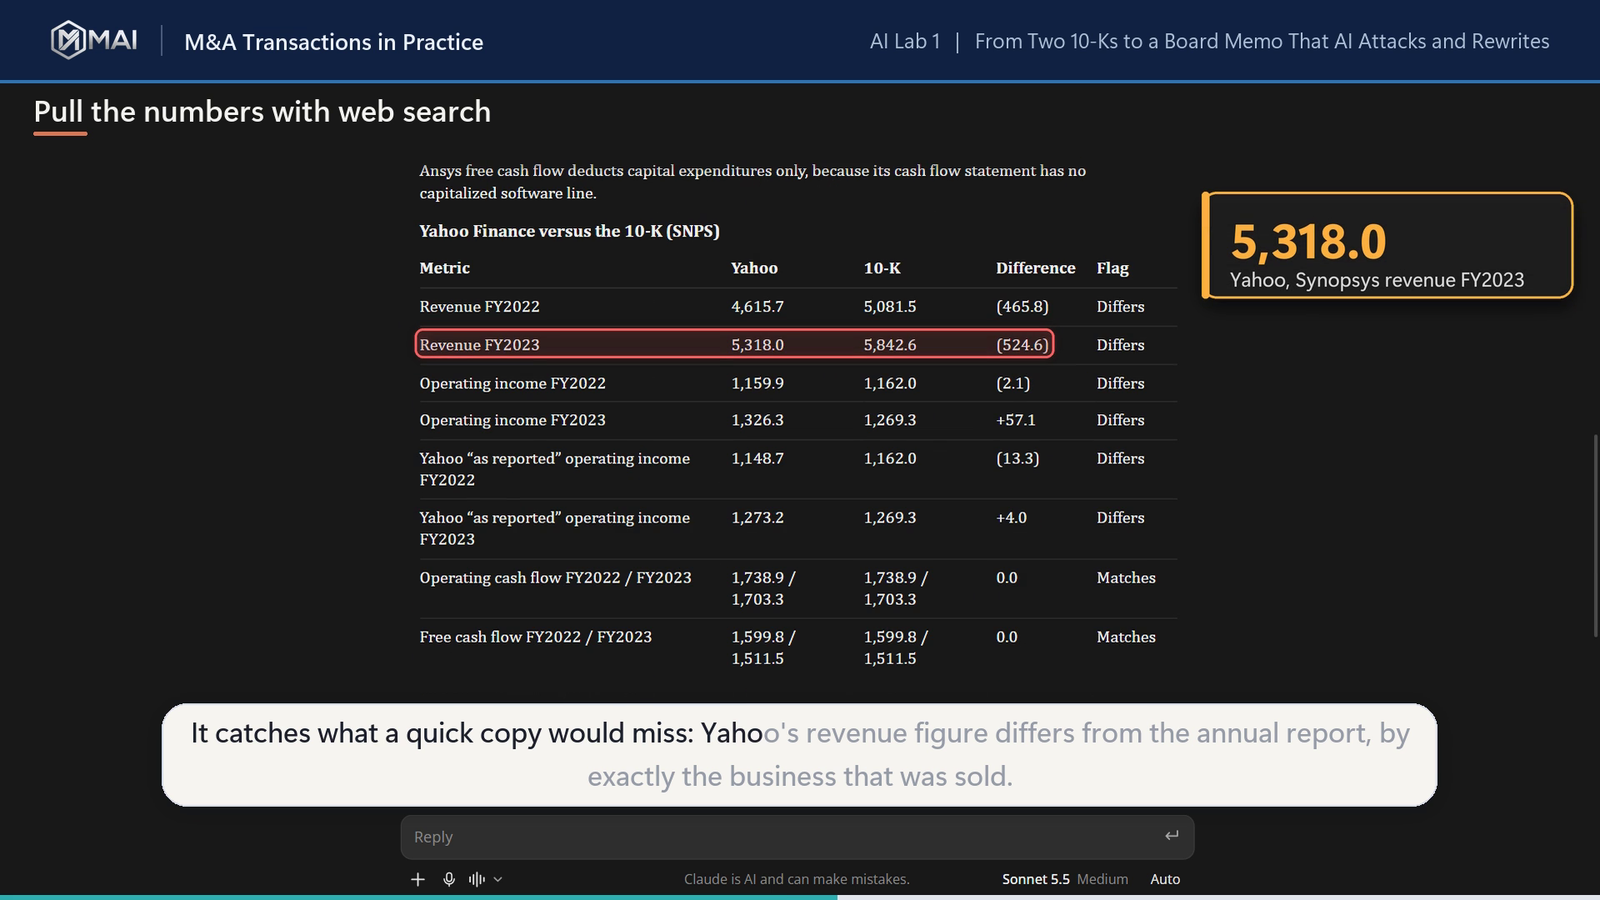
The observed response leaves early years unfilled when the attached reports do not contain them. It also flags a difference between a finance-site figure and the original filing. That is a useful intermediate result. A blank marked “not disclosed” tells you what to obtain next; a plausible invented value hides the missing work.
Give each extracted figure its own evidence trail. A practical table contains company, fiscal year, metric, amount, unit, reporting basis, document and source location. Add a status such as “matched”, “difference to reconcile” or “not found in the supplied file”. A citation alone is not the same as a checked value: open the stated location and compare it with the table.
If a source in your Claude financial analysis cannot be reached, record the access failure separately. It does not establish that the company never disclosed the information. Try the relevant filing or add the missing document. Do not ask the model to complete the series from memory simply to make the spreadsheet look finished.
3.1 A source table you can actually review
Use a separate row for each company, year and metric. Do not hide a disagreement by keeping only the number you prefer. For Claude financial analysis, the comparison table is a working record of the evidence, including the places where that evidence is incomplete.
For the revenue example, write “Synopsys; FY2023; revenue; 5,842,619; USD thousands; original presentation; FY2023 Form 10-K; consolidated income statement”. A second row can record the later continuing-business presentation. Preserve both source amounts before creating a converted column in millions. The comparison then shows why a reconciliation is needed, rather than presenting two unexplained totals.
For an unavailable year, leave the amount empty and write “not found in the supplied file” in the status column. Add an action such as “obtain the earlier annual report”. This is different from recording a numerical zero, which would enter the calculation as an observed result. It is also different from “not disclosed anywhere”, a broader claim the supplied files cannot establish.
The original prompt requests revenue, operating income and free cash flow. Give those metrics their own rows and definitions. Once you have reconciled revenue, move on to the other inputs; do not copy its checked status to the entire table. Retain the distinction between an amount directly read from a statement and an amount derived from two or more cash-flow lines.
4. Reconcile the reporting basis before calling a difference an error
A number in Claude financial analysis can be correctly copied and still be unsuitable for the comparison. The case makes this visible: Synopsys’s original FY2023 filing reports revenue of 5,842,619 in USD thousands. A later filing presents FY2023 continuing-business revenue of 5,318,014 in the same unit, with Software Integrity reported as discontinued operations. The documents use different presentation bases.
Compare the original FY2023 income statement with the later segment disclosure and discontinued-operations explanation. Converted to USD millions, the figures are 5,842.619 and 5,318.014. Their difference is 524.605 million. This source comparison explains why the lesson’s rounded figures differ; it does not establish that one website copied a number incorrectly.
| Check | What to record |
|---|---|
| Original presentation | FY2023 revenue, original filing, USD thousands |
| Later presentation | FY2023 revenue on the later continuing-business basis |
| Decision | Choose one consistent basis for the comparison; retain the reconciliation |
This is the central judgment in this Claude financial analysis example. Decide whether your task needs the business as reported at announcement or a consistently recast continuing-business series. Apply that choice across the years and companies. Do not combine an original historical total with a later recast series and then attribute the resulting growth rate to business performance.
5. Open one number yourself, then extend the check
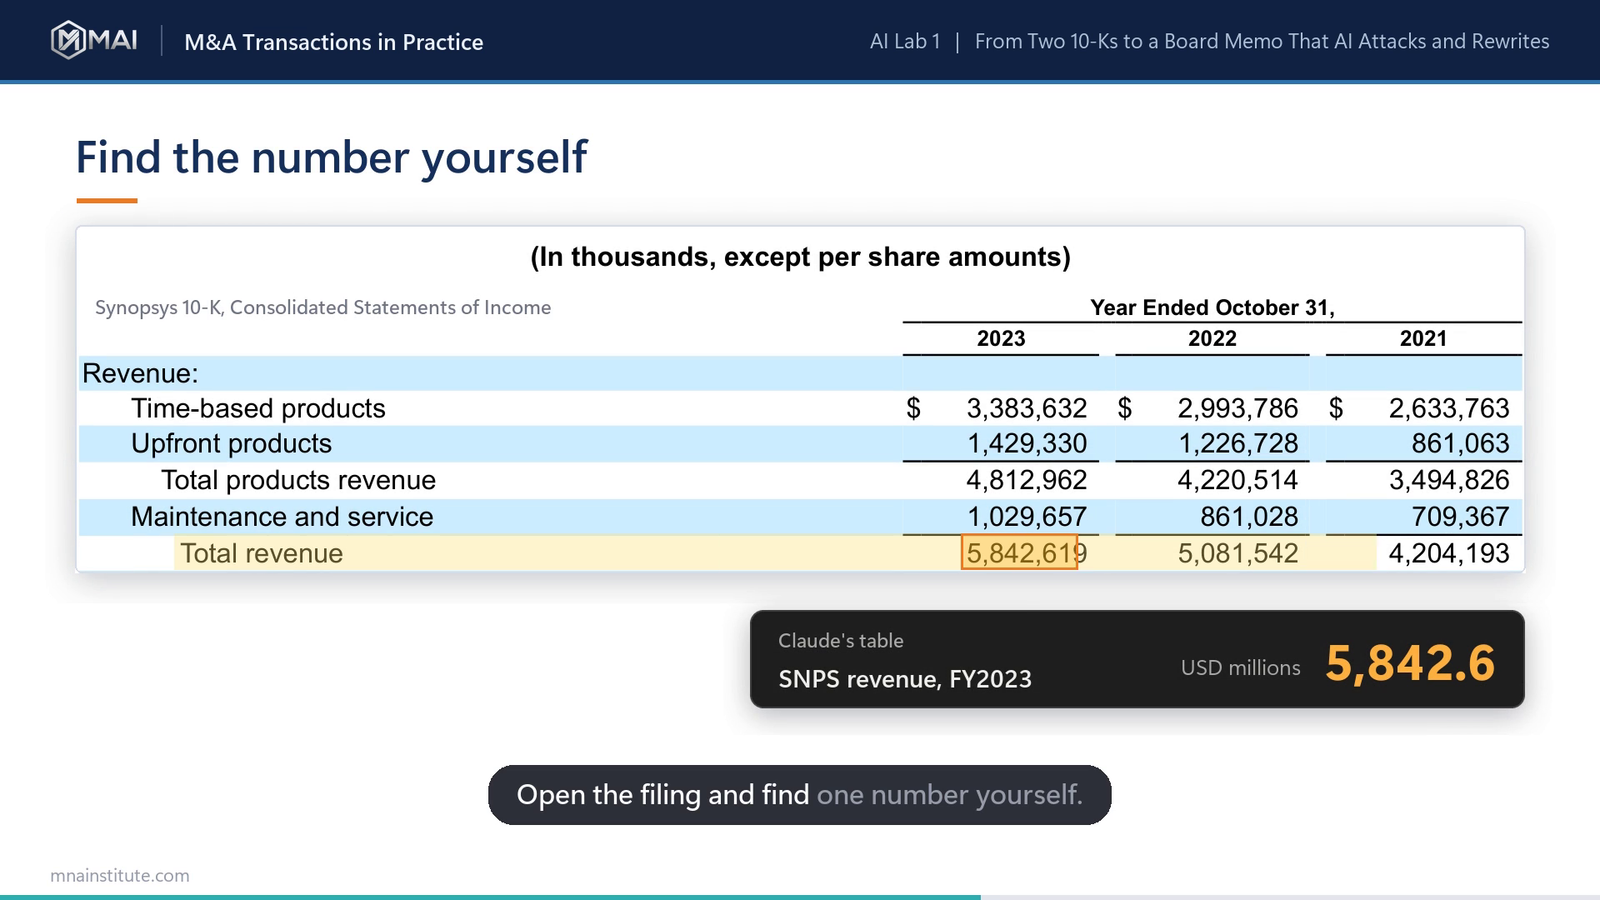
To verify Claude financial analysis, the video returns to the filing and matches a number on the financial statement. Repeat that step before using the rest of the table. Confirm the company and year, read the table’s unit, and check whether you are looking at consolidated accounts, a segment or a later recast comparative. Record the document section and page convention so another person can find it.
For example, 5,842,619 in USD thousands becomes 5,842.619 in USD millions. The lesson displays a rounded value of 5,842.6. That is a unit conversion and rounding choice, not a new financial observation. Keep the unrounded input for calculation and round only the displayed result.
Checking one figure is a starting point, not a declaration that the whole table is correct. Extend the check to the other figures used in the calculation and to every difference that affects the conclusion. If the workflow requests free cash flow, ask which cash-flow lines were used and what was subtracted. A matching revenue number does not validate a cash-flow definition.
Also check the years a table spans. A financial statement with three annual columns may not supply the five observations requested by the prompt. Keep unavailable years marked until you obtain the appropriate reports. These small checks matter more than a polished answer when the output will be reused by another analyst.
5.1 A practical review order
Start with the inputs that drive the chart. In this Claude financial analysis exercise, that means the revenue observations at the beginning and end of the growth period, the reporting basis of each observation and the fiscal-year labels. Then check any other figures you plan to reuse. A table can contain useful background figures that are outside the immediate calculation; record their review status separately.
When a source link opens, go to the cited statement or disclosure. Compare the displayed table heading, company, period and unit before comparing the amount. If the citation leads only to the report’s front page, ask for the relevant section and locate it yourself. Mark the row checked only after that comparison. If the link fails, keep the row pending and use the original case file rather than treating a clickable citation as proof.
6. Calculate a Claude financial analysis scenario with code
The second Claude financial analysis task is to fetch the older filing, execute code and chart two paths. This is the original calculation prompt:
Using the project files, SEC EDGAR filings and code, project Synopsys's revenue to fiscal 2028 at its FY2019-FY2023 revenue growth rate, and compare it with the combined Synopsys-Ansys revenue path grown at the two companies' combined FY2019-FY2023 growth rate. Chart both lines, shade the growth gap, and state the gap in dollars and in percentage points of growth.
In Claude financial analysis, code makes arithmetic inspectable, but it does not validate the source data or make an assumption true. Claude’s file and code capability can run calculations and produce files. The analyst must still check the inputs, period count and method. A CAGR between FY2019 and FY2023 uses four annual intervals. Ask the model to show the start value, end value and exponent, then independently recalculate a rate.
The chart in the lesson extends historical growth rates into an illustrative FY2028 scenario. Its combined series is a simple sum, and the companies have different fiscal year ends. It is not a calendarised pro forma model, a current revenue forecast or a calculation of acquisition value. State those limits next to the chart, where the reader will see them.
Check that the table, code and chart use the same units and inputs. Ask whether “growth gap” means a revenue amount or a difference in percentage points. A combined company can be larger while growing more slowly. Neither observation alone proves the acquisition creates value. If you change an assumption, keep the original run and recalculate the chart rather than editing its labels.
7. Hand over the evidence with the result
The output of this Claude financial analysis should be a small working pack: the source list, comparison table, reconciliation notes, code and scenario chart. Keep the missing items in the pack. Another analyst should be able to identify the figures used, reproduce a calculation and see what remains unresolved without rereading the entire conversation.
A useful handover separates four things: figures read from filings, figures calculated from those inputs, assumptions chosen for the exercise, and information not yet confirmed. It also records the reporting basis. This is especially important when a later filing changes how an earlier year is presented.
The free practice guide covers the project setup, original prompts and checks corresponding to this video. Use it to repeat the workflow with the historical case, then replace the companies, dates and documents for your own task. The guide does not include the later scorecard, board-memo or deck exercises from the full Lab.
For structured preparation toward the MADEX credential, explore the MADEX Certification Bundle: the M&A Full Course, Financial Modeling & Valuation Full Course and practical certification assessment. The credential is awarded after passing the assessment.
The M&A Full Course covers the transaction lifecycle and the core curriculum assessed in MADEX. For financial foundations, explore the Financial Modeling and Valuation Course with AI and Excel.
Related reading on the three financial statements and operating cash flow can help clarify the inputs before you automate their extraction.
7.1 What to send with the chart
Send the checked source table, the chosen reporting basis, the calculation method and the unresolved-items list alongside the chart. For Claude financial analysis, a useful handover note explains what the chart answers: an illustrative comparison under historical-growth assumptions. It also identifies what it does not answer, such as acquisition value or a calendarised combined-company forecast.
Keep the original model response and the reviewed version distinct. Record which inputs you changed and why, so a colleague can follow the judgment instead of guessing from the final picture. The same principle applies when you repeat the exercise with another company: start a fresh source list, state the new analysis date and retain the assumptions used for that run.
Before sending your Claude financial analysis, open the evidence pack as the next reader would. Can you reach each source, identify the calculation inputs and tell an unresolved item from a checked figure? If any answer is unclear, improve that specific part of the pack before writing a stronger conclusion.
Questions about Claude financial analysis
Can I use Claude financial analysis for a 10-K?
It can help extract, compare and calculate information from a supplied filing. The useful test is whether you can trace the figures to the original and reproduce the calculation. The video demonstrates that workflow; it does not verify every part of a company’s annual report.
Why can the same year have two revenue figures?
Check the unit, reporting perimeter and document version. In this case, the original presentation and later continuing-business presentation differ. Reconcile the basis before deciding which series your assignment requires.
Does running code make the forecast reliable?
Code can make the arithmetic reproducible. Source completeness, consistent definitions and scenario assumptions still need human review. A historical-growth extension is an illustration under stated assumptions.
Can I follow the exercise in ChatGPT?
The guide identifies corresponding tools, including Projects, Search and Data analysis. Availability and interface labels depend on the workspace. Keep the same source and calculation checks whichever tool you use.