Ratio and Analysis: How to Read Financial Statements in 7 Steps
Most learners do not struggle because financial statements are impossible to read.
They struggle because they read the statements as isolated pages instead of connected evidence.
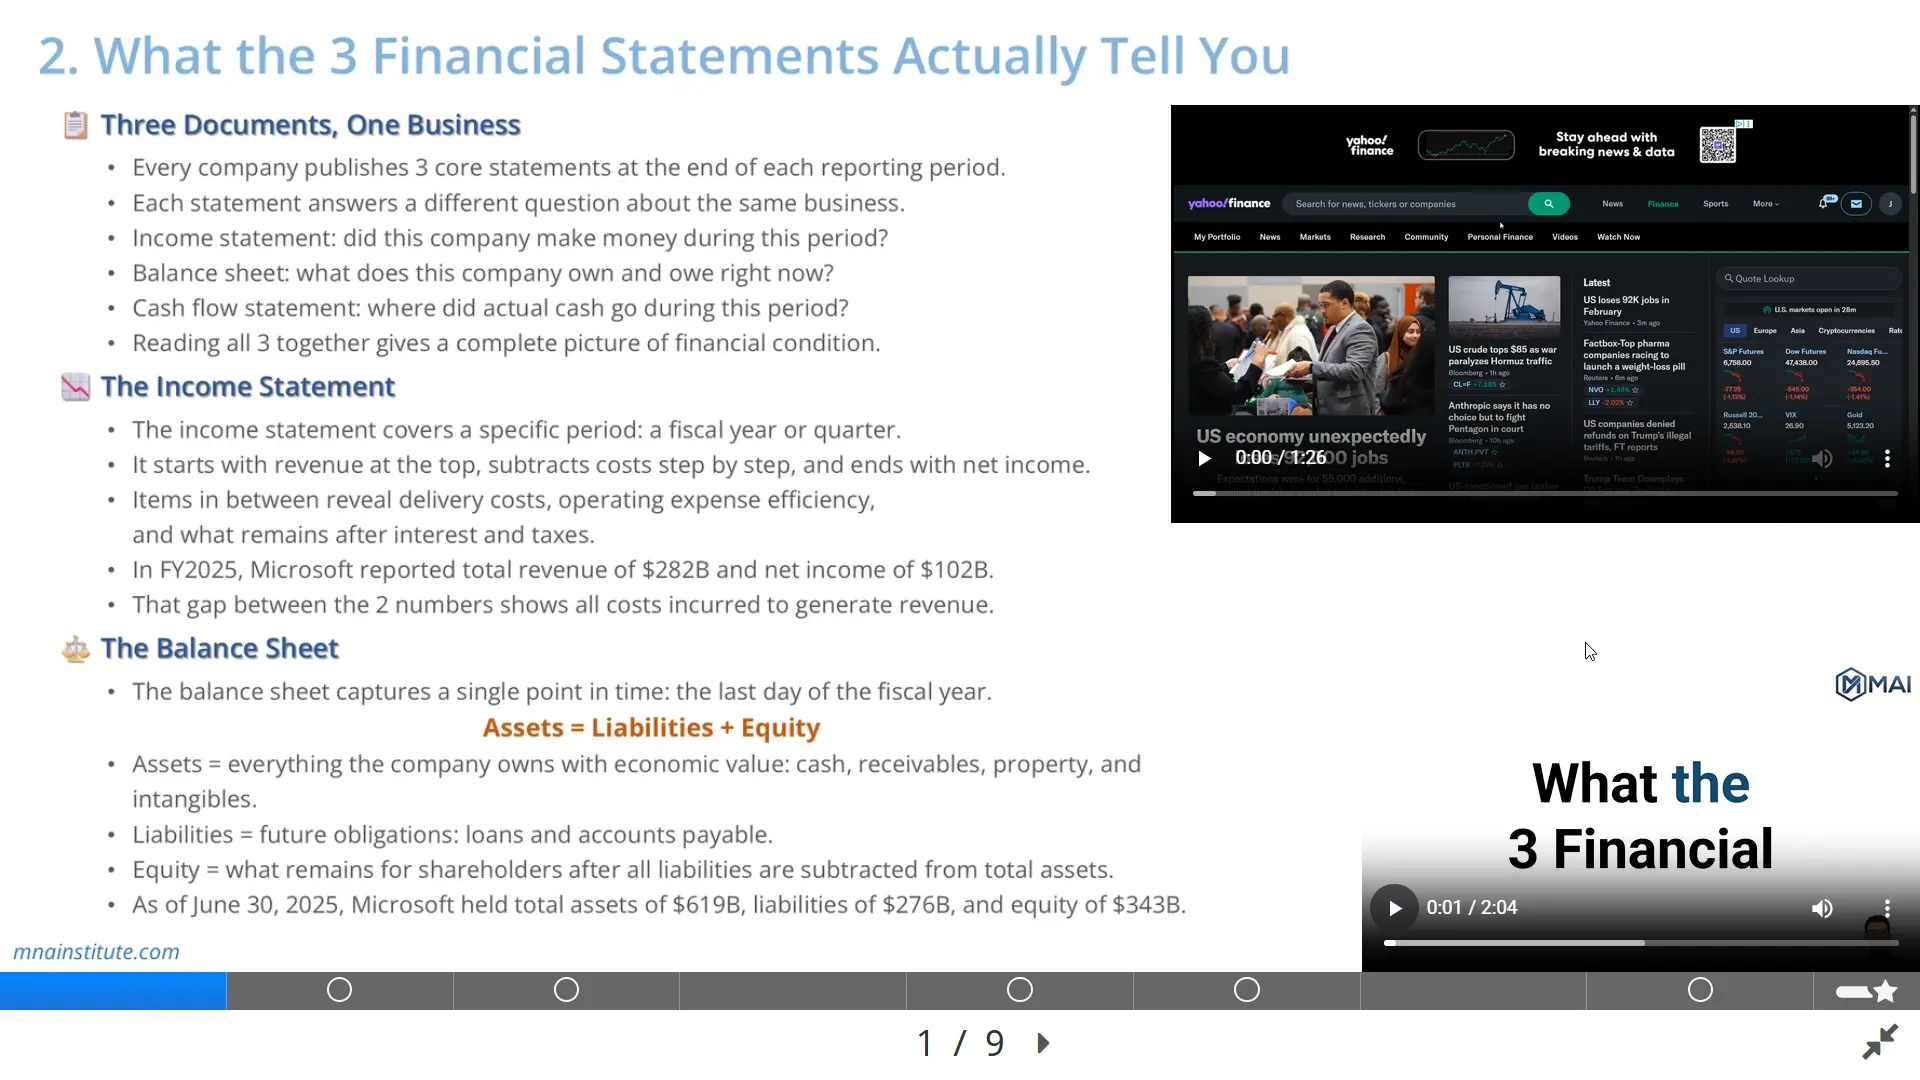
The income statement shows performance, the balance sheet shows financial position, and the cash flow statement shows whether accounting profit actually converts into cash.
Ratio and analysis becomes useful only when those three statements are read together and interpreted against business reality.
A margin ratio without revenue quality is thin evidence.
A liquidity ratio without working capital context can mislead.
A leverage ratio without cash flow durability gives an incomplete risk view.
The purpose of this article is to show how to read financial statements in a practical analyst workflow, not as a formula memorization exercise.
It also explains why financial ratio analysis should be connected to 10-K reading, Excel modeling, AI prompting, and investment judgment.
The result is a clearer path from raw filings to valuation, credit, M&A, and equity research conclusions.

Why Most Financial Statement Training Feels Too Thin
A common financial statement lesson teaches definitions first, then ratios, then a few generic examples.
That approach can help beginners recognize the income statement, balance sheet, and cash flow statement.
It often fails when the learner must make a real analytical decision.
The issue is not the absence of formulas.
The issue is the absence of workflow.
Ratio and analysis should begin with a question: what decision are we trying to support?
An equity analyst asks whether future earnings can grow faster than the market expects.
A credit analyst asks whether cash flow can support obligations under stress.
An M&A analyst asks whether historical performance supports the acquisition price and whether hidden risks require a lower valuation.
A corporate finance team asks whether operating performance, working capital, and capital discipline support management’s strategic plan.
The same financial statements can answer all of these questions, but only if the reader knows where to look and how to connect evidence.
That is why ratio and analysis must move beyond simple calculation.
The analyst has to interpret trend, quality, risk, comparability, and valuation impact.
|
Dimension |
Generic financial statement lesson |
Applied analyst workflow |
|
Starting point |
Definitions and formula memorization |
Decision question first, then evidence |
|
10-K use |
Often treated as background reading |
Used as the source for business model, risk, accounting policy, and footnote evidence |
|
Ratios |
Calculated as isolated outputs |
Grouped by analytical purpose and tested against statement relationships |
|
Excel work |
Formula practice |
Repeatable model for trend, ratio, red flag, and commentary execution |
|
AI use |
Sometimes used for summarization only |
Used for extraction, structuring, calculation support, and draft commentary with source verification |
|
Final outcome |
Learner knows what ratios mean |
Learner can defend investment, credit, valuation, and deal judgment |
The difference is not cosmetic.
A generic course may teach what current ratio means, but an analyst workflow asks why current assets increased.
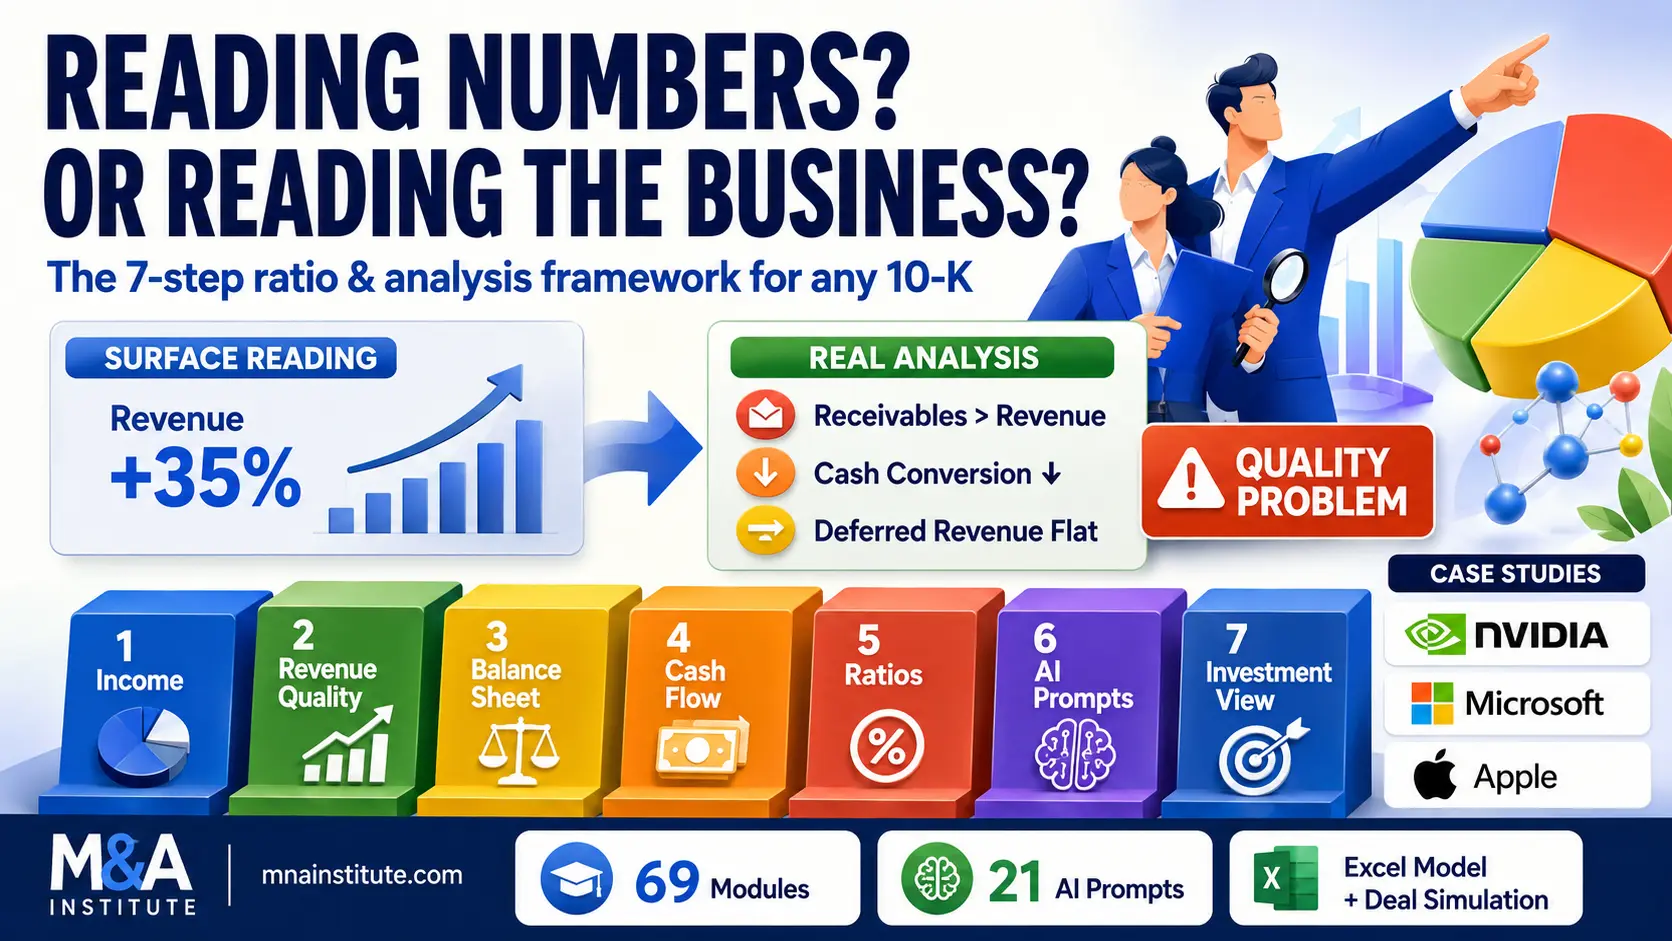
If receivables rose faster than revenue, the signal may be weaker cash collection rather than stronger growth.
If inventory expanded before demand was proven, the signal may be future write-down risk.
If EBITDA improved while operating cash flow weakened, the signal may be lower earnings quality.
This is where ratio and analysis becomes an investment discipline.

Step 1: Start with the 10-K Before the Ratios
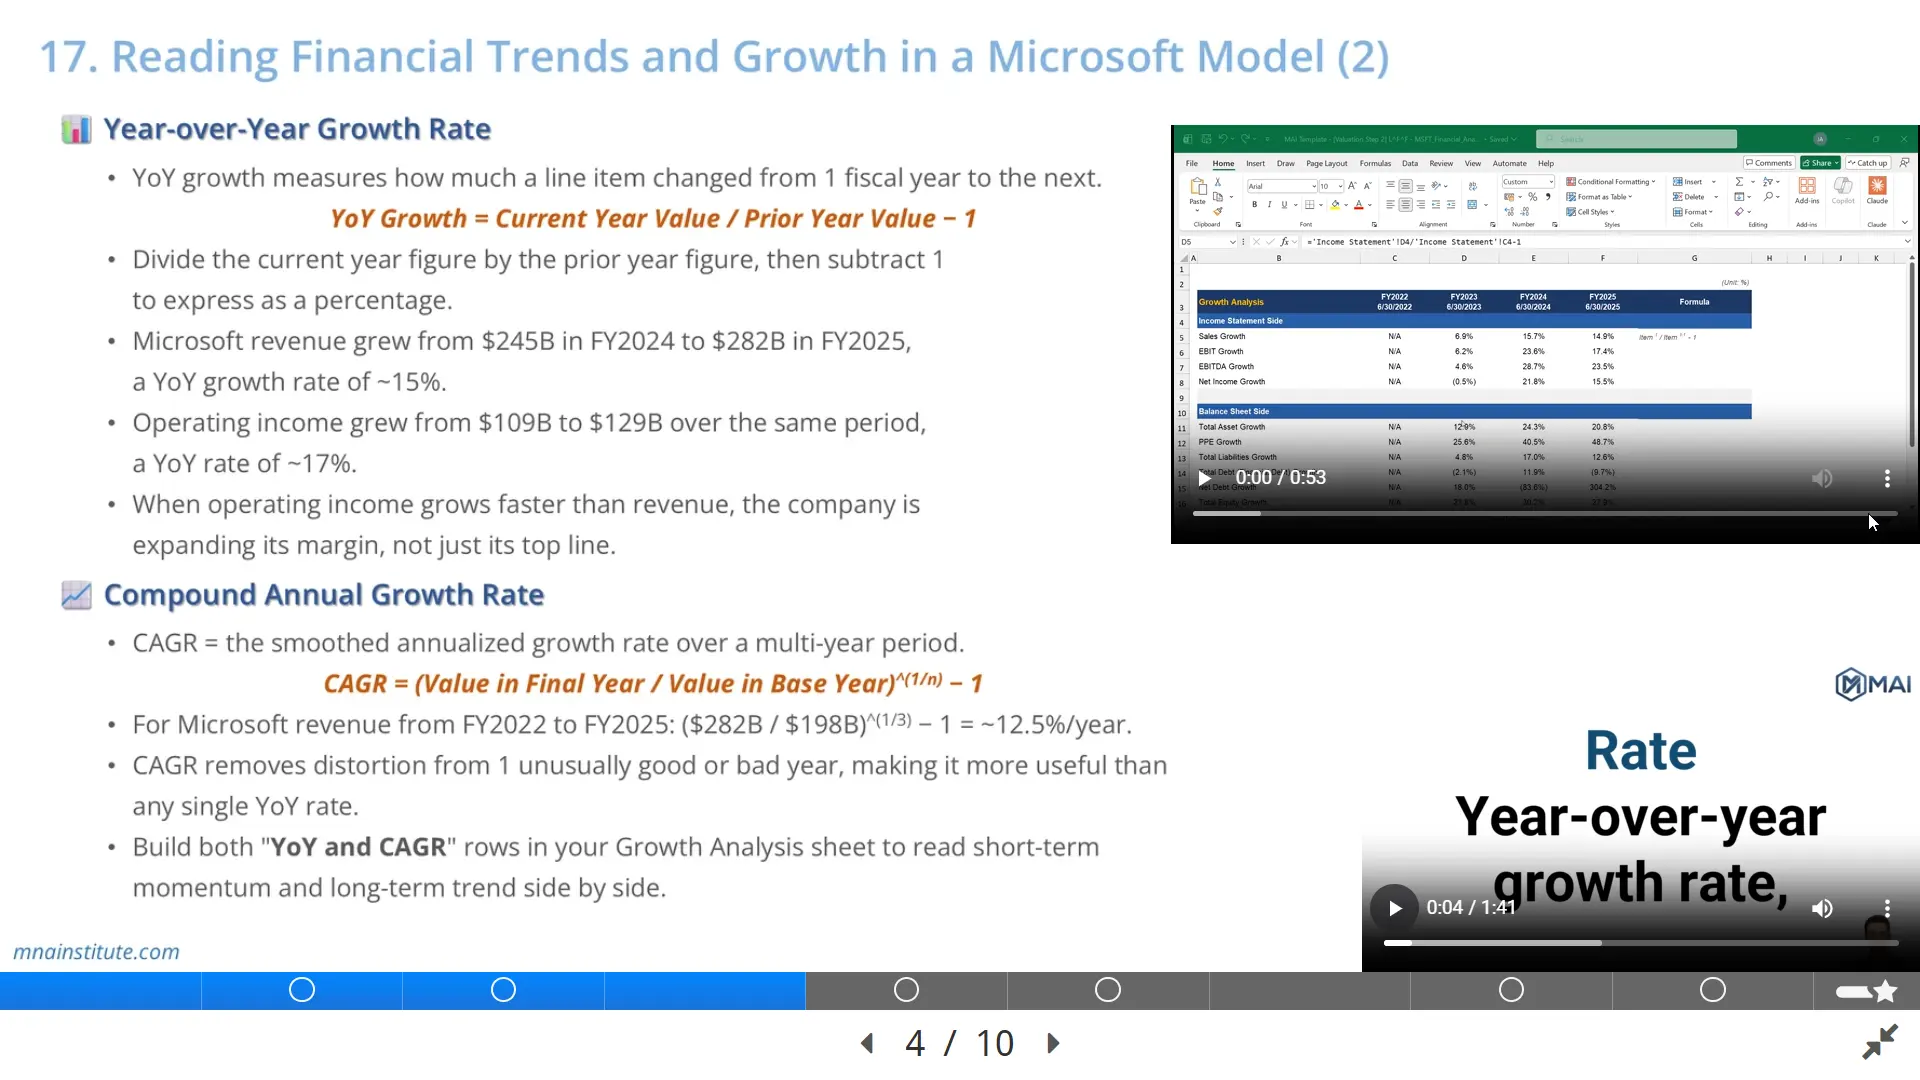
The first step in ratio and analysis is not opening Excel.
It is reading the filing that explains the business behind the numbers.
For U.S. public companies, the Form 10-K gives a detailed annual view of the company, including its business, risk factors, selected financial information, management discussion, audited financial statements, and notes.
The SEC explains that most U.S. public companies file a 10-K every year and that the document follows a set order of topics.
That order matters because it helps the analyst move from business model to risk to financial statements.
A practical 10-K reading sequence looks like this:
- Read the business description to understand products, customers, geographies, and revenue drivers.
- Read risk factors to identify the issues management believes could affect performance.
- Read management discussion to understand growth, margins, cash flow, and management’s explanation of changes.
- Read the financial statements and notes to verify the numbers behind the narrative.
- Read segment disclosures and accounting policies to understand what the headline ratios may hide.
This sequence matters because ratio and analysis without business context can produce shallow conclusions.
For example, a software company and a semiconductor company may both report high gross margins, but the investment meaning is different.
The software company may have recurring subscription revenue with low incremental delivery cost.
The semiconductor company may have exceptional margin during a product cycle, but also needs heavy inventory planning, supply chain discipline, and customer demand visibility.
How to read a 10-K report is therefore not just a filing skill.
It is the starting point for deciding which ratios deserve attention.
Step 3: Build Ratio and Analysis by Analytical Purpose
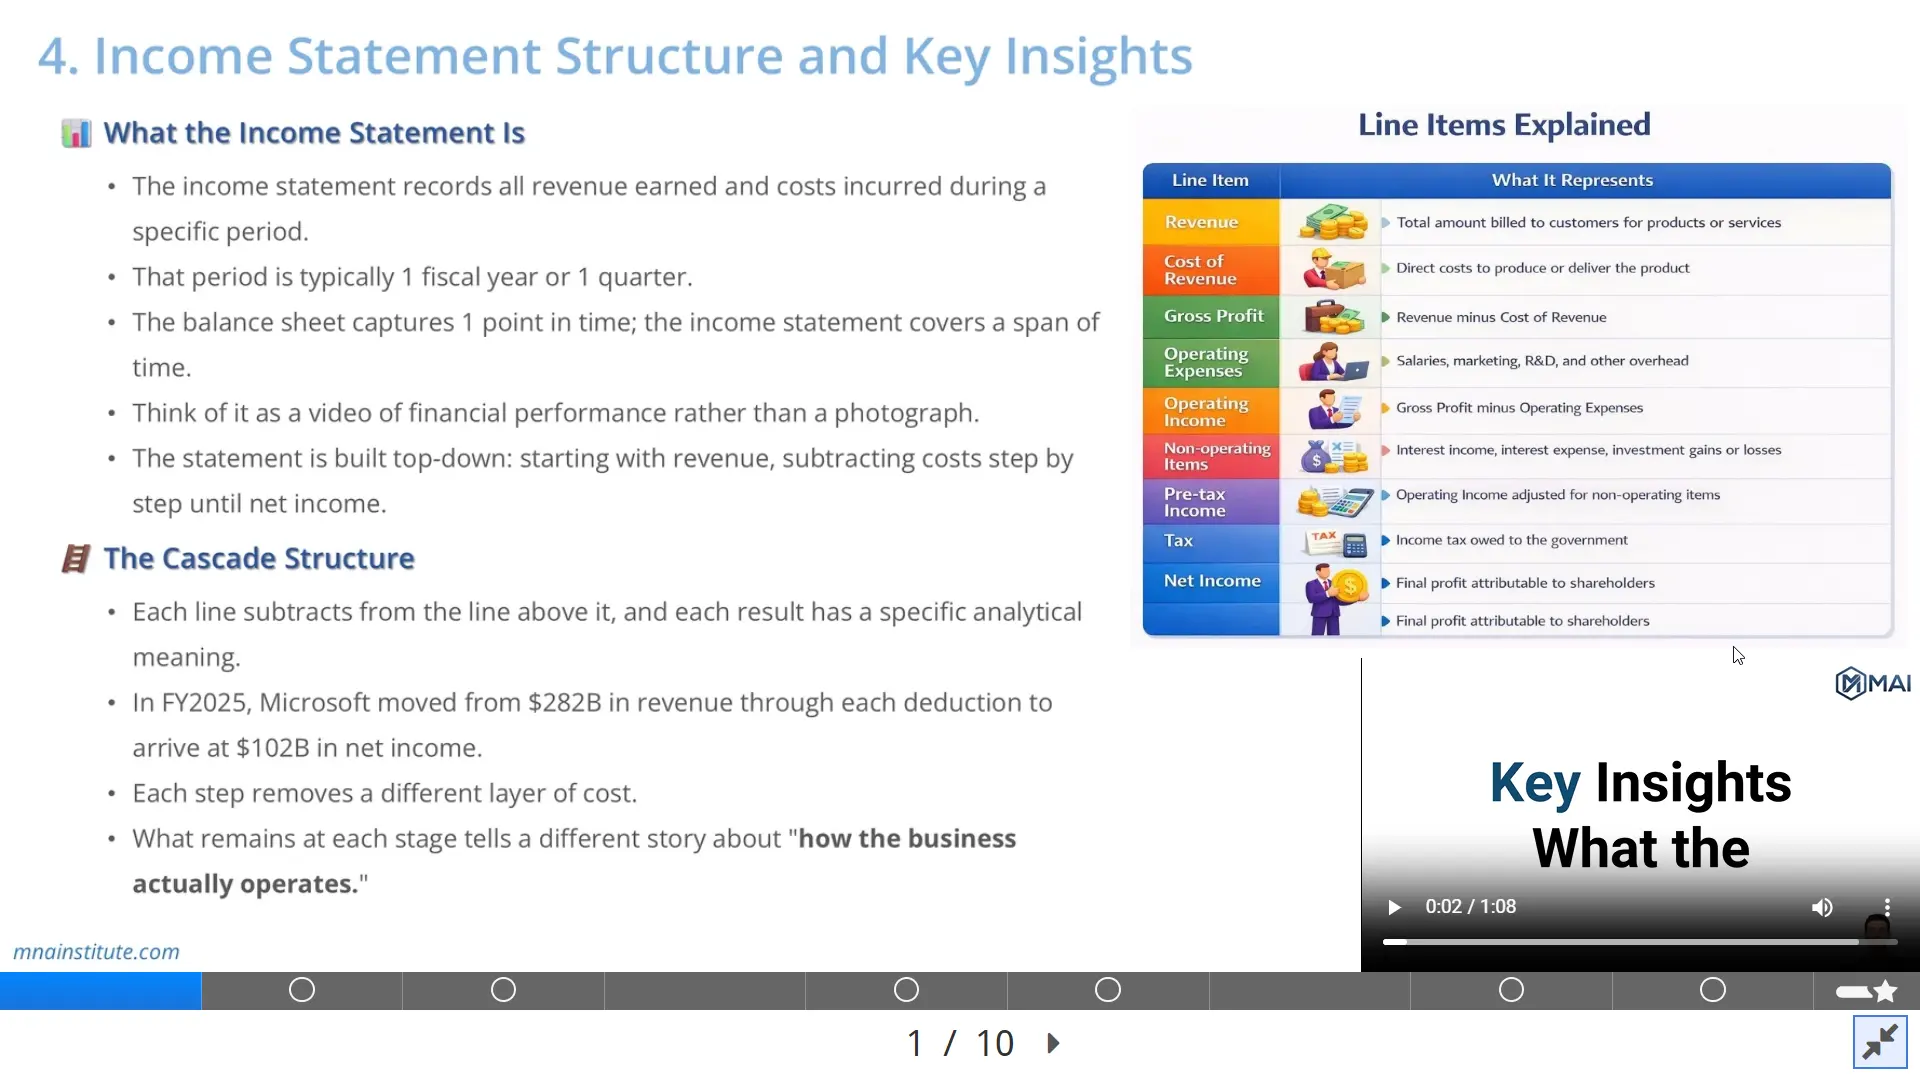
The third step is to group ratios by the question they answer.
A long list of formulas is not a workflow.
A practical ratio and analysis framework usually covers seven analytical purposes.
Growth
Growth ratios test whether the business is expanding and whether that expansion is broad, recurring, and sustainable.
Revenue growth, gross profit growth, operating income growth, and segment growth should be compared over time.
The analyst should also ask whether growth is organic, acquisition-driven, price-driven, or volume-driven.
Profitability
Profitability ratios test how much profit the company keeps at each level of the income statement.
Gross margin, EBITDA margin, operating margin, net margin, return on assets, return on equity, and ROIC each answer a different question.
A high gross margin may reflect strong pricing power.
A high operating margin may reflect scale, automation, or disciplined cost control.
A high ROIC may show that management converts invested capital into economic value.
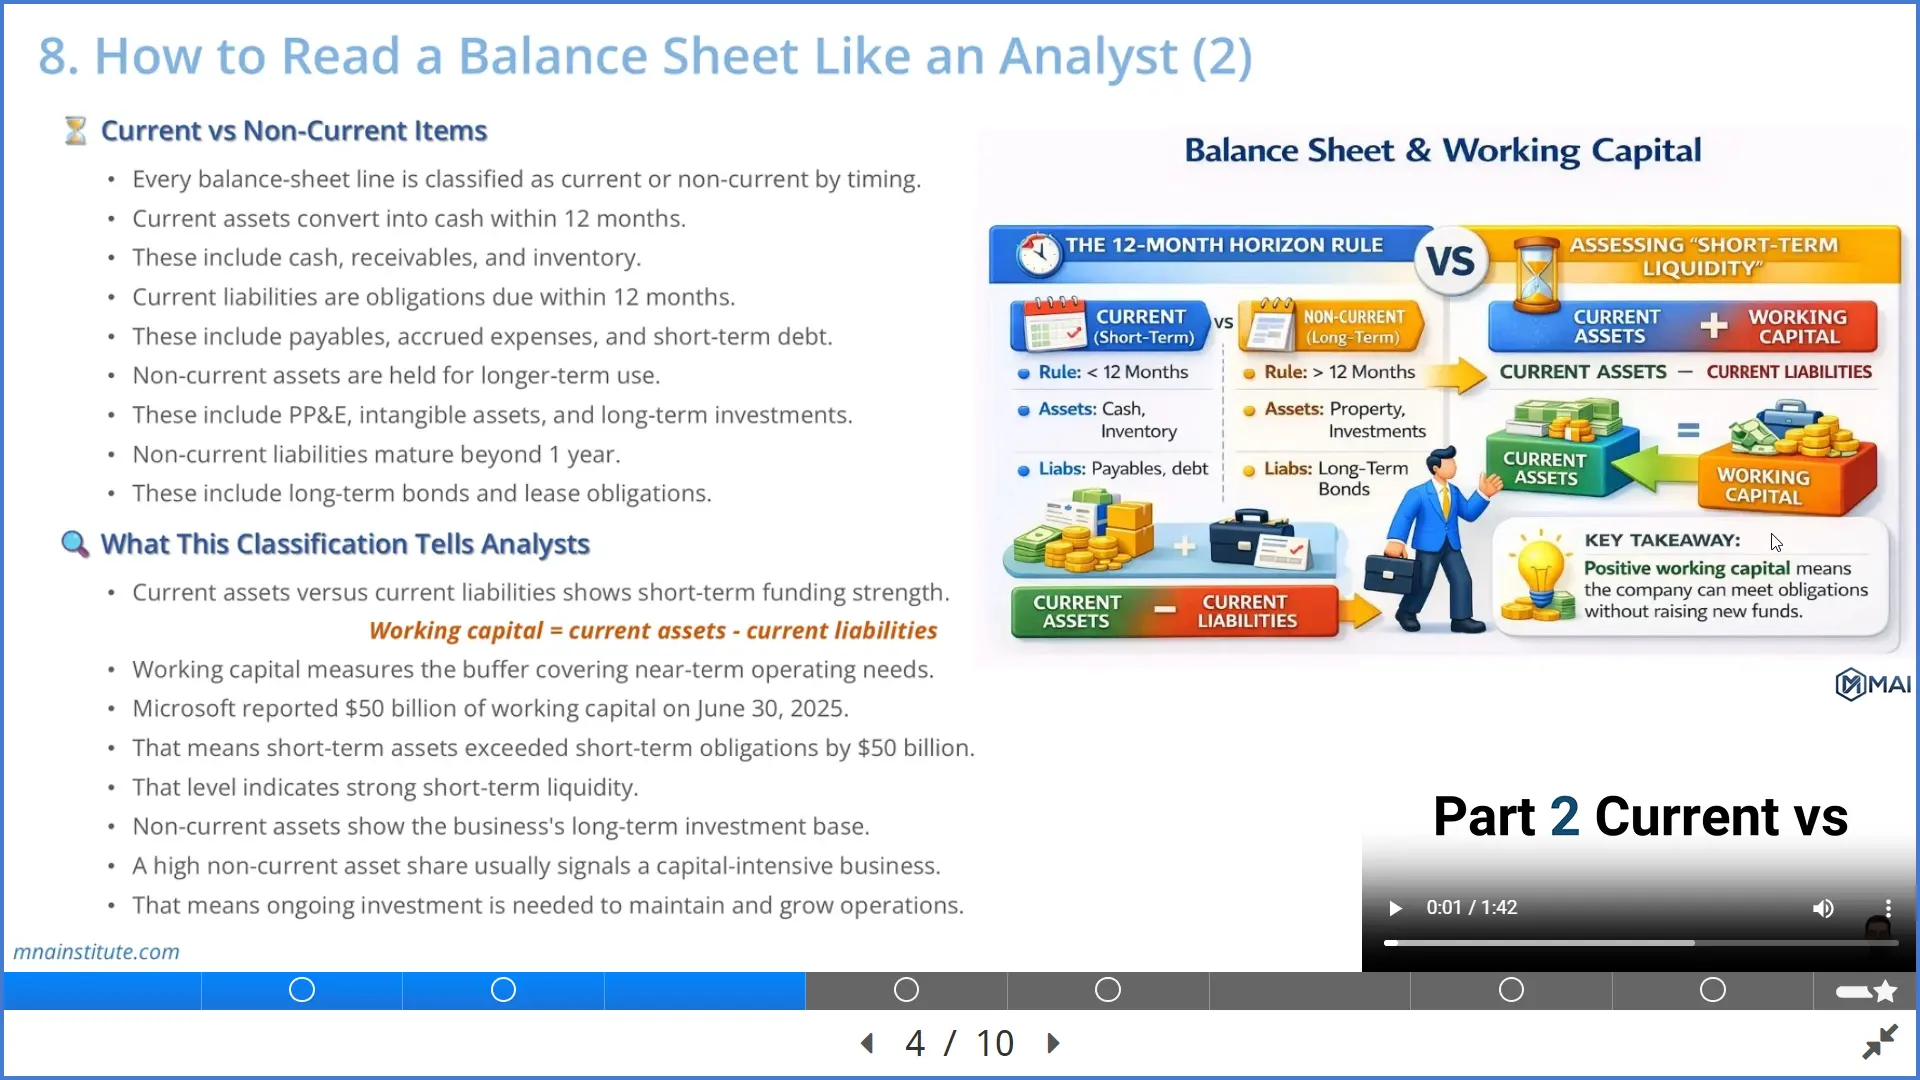
Liquidity
Liquidity ratios test whether the company can meet short-term obligations.
Current ratio and quick ratio are useful, but they should not be read mechanically.
A high current ratio driven by slow-moving inventory may not be as strong as it appears.
A lower current ratio in a business with fast cash collection and strong supplier terms may be less concerning.
Leverage and solvency
Leverage ratios test financial risk and downside resilience.
Net debt to EBITDA, debt to equity, interest coverage, and fixed charge coverage show how much pressure creditors can place on the business.
For credit and M&A work, leverage analysis should be connected to cash flow, covenant flexibility, refinancing risk, and industry cyclicality.
Efficiency and working capital
Efficiency ratios show how quickly the business turns assets into revenue and cash.
Receivable days, inventory days, payable days, cash conversion cycle, asset turnover, and working capital intensity are especially useful when testing growth quality.
A company can grow revenue but consume cash if customers pay slowly or inventory builds ahead of demand.
Cash flow and FCF
Cash flow ratios test whether profit converts into cash.
Operating cash flow conversion, free cash flow margin, CapEx intensity, and cash flow to debt help the analyst judge whether earnings are durable.
This is often where weak earnings quality becomes visible.
Valuation multiples
Valuation ratios connect the operating analysis to market price.
P/E, EV/EBITDA, EV/Sales, EV/FCF, and P/B can be useful, but only when paired with growth, margin, risk, and capital intensity.
A low multiple can mean undervaluation.
It can also mean the market sees declining earnings quality, weak cash flow, or structural risk.

Step 4: Test Earnings Quality Before Trusting the Output
The fourth step is to test whether reported earnings are high quality.
CFA Institute materials emphasize that high-quality earnings are more useful for valuation because they better reflect sustainable performance.
Low-quality earnings may come from non-recurring items, accounting choices, or performance that does not cover the cost of capital.
This is why ratio and analysis must look beyond the income statement headline.
The analyst should test at least five areas.
- Revenue quality: Is revenue recurring, cash-backed, and supported by customer demand?
- Margin quality: Are margins improving from sustainable scale, or from temporary cost cuts and accounting classification?
- Cash conversion: Does net income convert into operating cash flow and free cash flow?
- Adjustment quality: Are management’s adjusted EBITDA add-backs truly one-time, or recurring costs presented as non-recurring?
- Balance sheet support: Are receivables, inventory, deferred revenue, and payables consistent with the earnings story?
For example, assume a company reports 18% revenue growth and 25% EBITDA growth.
At first glance, the financial ratio analysis looks positive.
Then the analyst discovers that receivables grew 45%, inventory grew 40%, and operating cash flow declined.
The conclusion changes immediately.
The company may still be growing, but the quality of that growth requires deeper testing.
That is how to read financial statements like an analyst.
You do not accept the ratio.
You ask what the ratio depends on.

Step 5: Use Financial Red Flags to Challenge the Story
The fifth step is to identify red flags that challenge management’s narrative.
Financial red flags do not automatically mean a company is weak.
They mean the analyst must investigate before trusting the conclusion.
Common red flags include:
- Revenue growing faster than cash collection.
- EBITDA improving while operating cash flow weakens.
- Inventory rising faster than sales.
- CapEx being delayed while free cash flow appears strong.
- Debt increasing while management highlights adjusted earnings.
- Gross margin expanding without a clear business explanation.
- Large one-time adjustments appearing year after year.
- Valuation multiples expanding while ROIC or FCF deteriorates.
A strong ratio and analysis workflow converts these red flags into questions.
Is the issue temporary or structural?
Is the signal caused by seasonality, accounting treatment, acquisition timing, customer behavior, or real deterioration?
Can the risk be quantified?
Does it affect valuation, credit risk, acquisition price, or investment conclusion?
This is where financial statement reading moves from description to judgment.

Step 6: Use Excel to Turn Financial Statements into a Repeatable Model
The sixth step is to move the analysis into Excel once the filing logic is clear.
Excel does not create judgment by itself.
It creates a repeatable structure for organizing evidence.
A strong Excel-based financial analysis model should include:
- Source inputs from the income statement, balance sheet, cash flow statement, and market data.
- Historical trend analysis across revenue, margins, expenses, cash flow, leverage, and valuation multiples.
- Ratio schedules grouped by growth, profitability, liquidity, leverage, efficiency, cash conversion, and valuation.
- Commentary cells that force the analyst to explain what changed and why it matters.
- Output tables that connect financial analysis to valuation, credit, M&A, or investment judgment.
The discipline is not merely building formulas.
The discipline is creating a model where each formula has analytical purpose.
For example, EBITDA margin should not sit alone in a spreadsheet.
It should be connected to revenue growth, cost structure, operating leverage, working capital, CapEx, and FCF conversion.
In M&A work, the same model can support diligence questions.
If revenue quality is weak, the buyer may challenge seller projections.
If working capital requirements are rising, the buyer may adjust the purchase price or require a normalized working capital target.
If FCF is below EBITDA, the buyer may apply a lower multiple or demand stronger downside protection.
That is why ratio and analysis is not separate from valuation work.
It is the evidence layer under the valuation conclusion.
Step 7: Use AI Prompts for Financial Analysis, Then Verify Everything
The seventh step is to use AI carefully.
AI prompts for financial analysis can save time when extracting and organizing data.
They can summarize risk factors, pull financial line items from filings, structure Yahoo Finance tables, calculate ratios, and draft first-pass commentary.
But AI should accelerate the workflow, not replace verification.
A practical AI workflow has three layers.
- Extraction: Use AI to pull tables, line items, footnote details, and management commentary into a structured format.
- Calculation: Use AI to help organize ratio formulas, identify missing inputs, and check whether outputs are internally consistent.
- Interpretation support: Use AI to generate draft explanations, red flag lists, peer comparison questions, and analyst commentary prompts.
The analyst must still verify source figures against the filing.
The analyst must still decide whether the ratio matters.
The analyst must still connect the output to investment, credit, valuation, or M&A judgment.
For example, an AI prompt may identify that operating cash flow declined while revenue increased.
That is useful.
It does not, by itself, explain whether the cause is receivables, inventory, contract terms, acquisition integration, seasonality, or customer stress.
The analyst has to check the cash flow statement, working capital schedule, MD&A, and footnotes.
This is the right way to combine AI with ratio and analysis.
Let AI accelerate the first draft.
Let the analyst own the conclusion.

How This Approach Differs from a Generic Financial Statement Lesson
The strongest learning path is not simply more content.
It is a better sequence.
A learner should move from filing comprehension to ratio calculation, then from ratio calculation to earnings quality, red flags, Excel modeling, AI prompting, and investment judgment.
The Financial Statement Analysis Course with AI for Equity Research follows this kind of applied analyst workflow.
The course materials describe a structure that moves from 10-K reading to income statement analysis, balance sheet analysis, cash flow analysis, Excel modeling, industry frameworks, AI prompts, and final execution tasks.
That matters because ratio and analysis is learned best when the learner repeatedly converts numbers into decisions.
A quiz can reinforce concepts.
A template can structure the work.
An Excel model can test whether the learner can calculate and interpret correctly.
An AI simulation can pressure-test judgment by asking whether growth quality, EBITDA, FCF, net debt, ROIC, and valuation logic actually support a deal conclusion.
This is the bridge from learning terminology to performing analysis.
A Practical Ratio and Analysis Checklist
Before writing a conclusion, the analyst should run one final ratio and analysis checklist.
First, ratio and analysis should explain what changed, not just what the formula produced.
Second, ratio and analysis should compare the company against its own history, its industry economics, and its valuation context.
Third, ratio and analysis should separate accounting profit from cash conversion and reinvestment needs.
Fourth, ratio and analysis should identify where additional 10-K evidence, Excel schedules, or AI-supported extraction is needed before the conclusion is reliable.
Fifth, ratio and analysis should end with judgment: whether the financial statements support investment, credit, valuation, or M&A confidence.
Related Courses
The broader learning path connects financial statement analysis to valuation, modeling, and M&A execution.
- The Financial Modeling and Valuation Course with AI and Excel extends the same analytical discipline into three-statement modeling, WACC, DCF, comparable company analysis, and valuation report writing.
- The 3-Statement Financial Modeling Course with AI focuses on turning company research into forecast assumptions, EPS, EBITDA, FCF, and a linked financial model.
- The Mergers and Acquisitions Online Course uses financial statement evidence to support deal screening, due diligence, valuation, negotiation, and integration decisions.
- The M&A Due Diligence Course applies the same evidence-based mindset to commercial, financial, legal, and HR diligence workstreams.
- The Post Merger Integration Course connects deal logic to post-close execution, synergy tracking, operating continuity, and value creation.
Sources
- SEC Investor Bulletin: How to Read a 10-K
- SEC Investor.gov: How to Read a 10-K
- CFA Institute: Financial Analysis Techniques
- CFA Institute: Evaluating Quality of Financial Reports