WACC Calculation: ROIC vs WACC with NVIDIA at 11.71%
A valuation model is not finished when the discount rate is calculated.
The harder question is whether the business earns more than the capital it consumes.
That is where WACC calculation becomes a decision tool rather than a spreadsheet input.
The WACC equation brings together the return required by shareholders, the return required by creditors, and the capital structure weights that decide how much each provider matters.
Once that blended rate is built, an analyst can compare it with return on invested capital, test whether the company creates economic value, and judge whether new projects clear the hurdle rate.
NVIDIA provides a useful example because its WACC is driven almost entirely by equity capital, while its operating returns are far above its cost of capital.
In this article, WACC calculation is assembled from inputs, checked with documented sources, stress-tested with beta and ERP sensitivity, and then applied to ROIC vs WACC and a hypothetical investment decision.

From Components to One WACC Calculation
WACC stands for Weighted Average Cost of Capital.
It represents the blended return the company must earn to satisfy both shareholders and creditors.
The formula is:
WACC = Ke × [E / (D + E)] + Kd × (1 – t) × [D / (D + E)]
Ke is the cost of equity.
Kd is the pre-tax cost of debt.
t is the effective tax rate.
E is the market value of equity.
D is the market value of debt.
The equity component is:
Equity component = Ke × [E / (D + E)]
The debt component is:
Debt component = Kd × (1 – t) × [D / (D + E)]
The equity weight and debt weight must add to 100%.
That sounds simple, but the professional work is not in writing the WACC equation.
The professional work is in choosing the right inputs, sourcing them properly, and checking whether the final WACC calculation makes economic sense.
A small change in beta, equity risk premium, or capital structure weights can change the discount rate and therefore change the DCF value.
This is why the final WACC calculation should never be treated as an isolated number.
It should be part of a traceable valuation logic that connects cost of equity, cost of debt, market value weights, tax treatment, return on invested capital, and project hurdle rates.

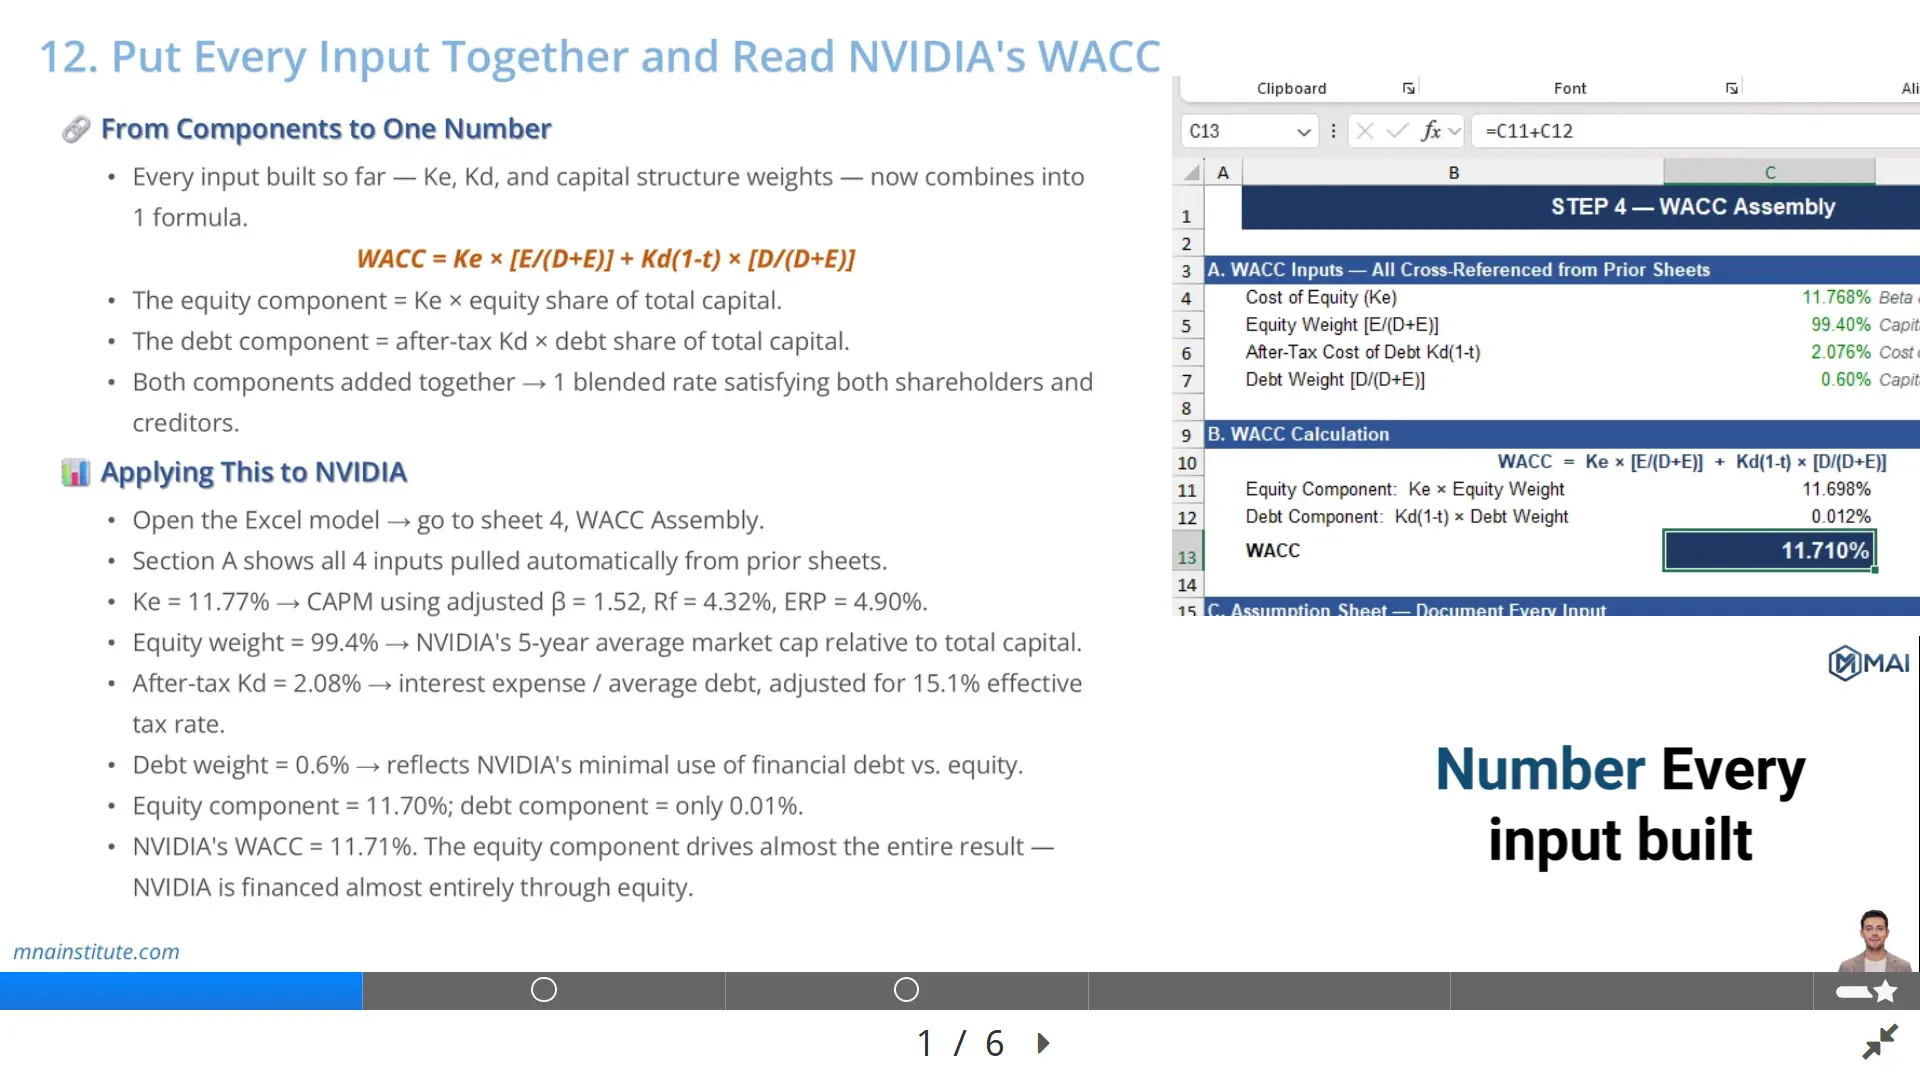
Applying the WACC Equation to NVIDIA
The NVIDIA example starts by pulling each WACC input from the prior model sheets.
Cost of equity is 11.77%.
That figure is derived from CAPM using adjusted beta of 1.52, risk-free rate of 4.32%, and equity risk premium of 4.90%.
The after-tax cost of debt is 2.08%.
That figure comes from NVIDIA interest expense divided by average debt, then adjusted for the 15.1% effective tax rate.
The equity weight is 99.4%.
The debt weight is 0.6%.
Those weights reflect NVIDIA’s very low financial debt relative to its market value of equity.
The calculation is:
WACC = 11.77% × 99.4% + 2.08% × 0.6%
WACC = 11.70% + 0.01%
WACC = 11.71%
The result is clear.
NVIDIA’s WACC calculation is almost entirely driven by the equity component.
The debt component contributes only 0.01% because the company uses minimal financial debt in the capital structure snapshot used in the model.
This is not unusual for a large, fast-growing technology company with extraordinary equity value and very low debt dependence.
It also means that the most important assumptions in the model are not the debt cost inputs.
They are the cost of equity inputs, especially beta and equity risk premium.
|
Input |
Value |
Role in WACC calculation |
|
Ke |
11.77% |
Required return for shareholders |
|
Equity weight |
99.4% |
Dominant capital structure weight |
|
After-tax Kd |
2.08% |
Debt cost after tax shield |
|
Debt weight |
0.6% |
Minimal influence on final WACC |
|
Final WACC |
11.71% |
Blended required return for the business |
Why Every WACC Assumption Must Be Documented
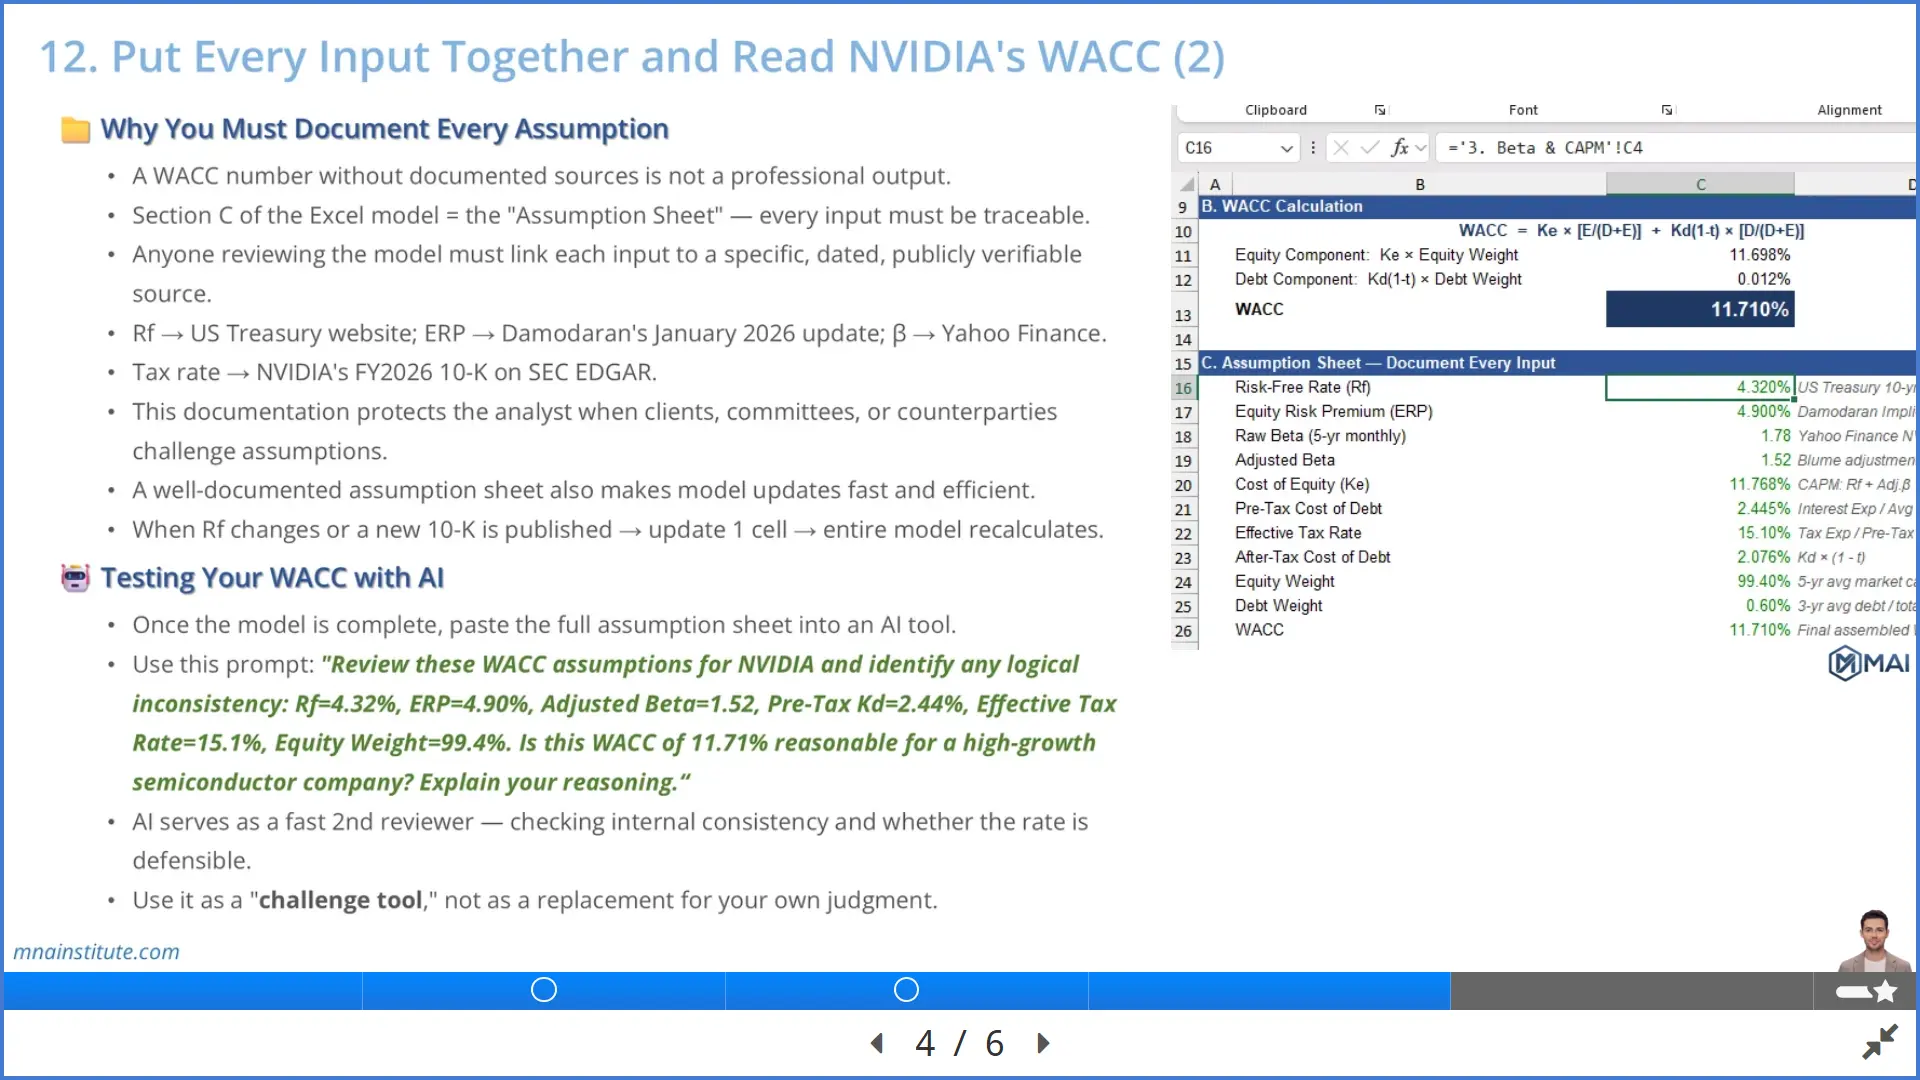
A WACC calculation without documented sources is not a professional valuation output.
It is only a number inside a spreadsheet.
The model reviewer must be able to trace every input back to a specific source, date, and logic.
The risk-free rate should link to the official government yield source used in the model.
For a US-listed company such as NVIDIA, the relevant source is usually the US Treasury yield curve.
The equity risk premium should link to a published source such as Damodaran’s implied ERP update.
The beta should link to a clear data source or a calculation sheet showing the raw beta, adjustment method, time period, and frequency.
The tax rate should link to the company filing or model calculation that produces the effective rate.
The debt and equity values should link to filings, market data, and the capital structure worksheet.
This documentation habit matters for three reasons.
- It lets a client, investment committee, or senior reviewer challenge the model without guessing where the inputs came from.
- It makes updates faster because one source cell can refresh the full WACC calculation.
- It protects the analyst from using stale assumptions after interest rates, market capitalization, beta, or filings change.
A clean assumption sheet is therefore not administrative decoration.
It is the audit trail behind the valuation.
When the WACC equation is challenged, the analyst should be able to show not only the formula but also the evidence behind each input.

Testing the WACC Calculation with AI
AI can help review WACC assumptions, but it should not be allowed to own the judgment.
A useful workflow is to complete the model first, then paste the assumption sheet into an AI tool as a second reviewer.
A practical prompt is:
Review these WACC assumptions for NVIDIA and identify any logical inconsistency: Rf = 4.32%, ERP = 4.90%, Adjusted Beta = 1.52, Pre-Tax Kd = 2.44%, Effective Tax Rate = 15.1%, Equity Weight = 99.4%. Is this WACC of 11.71% reasonable for a high-growth semiconductor company? Explain your reasoning.
The purpose is not to ask AI to calculate everything from scratch.
The purpose is to test whether the inputs are internally consistent.
For example, AI can flag whether the cost of debt looks inconsistent with the debt profile, whether the equity weight makes sense for a company with minimal debt, or whether the final WACC appears too low or too high relative to the company’s risk profile.
The analyst must still verify the source data.
The analyst must still decide whether beta is appropriate, whether ERP is current, whether the tax rate should be normalized, and whether the capital structure should reflect current or target weights.
In this sense, AI is best used as a challenge tool.
It can accelerate review and expose weak logic, but it cannot replace financial judgment.

How Sensitive Is WACC to Beta and ERP
No WACC calculation is certain.
Beta is estimated from historical stock price movement.
Equity risk premium depends on methodology and publication source.
Cost of debt changes with credit spreads and interest rates.
Capital structure weights change as market capitalization and debt balances move.
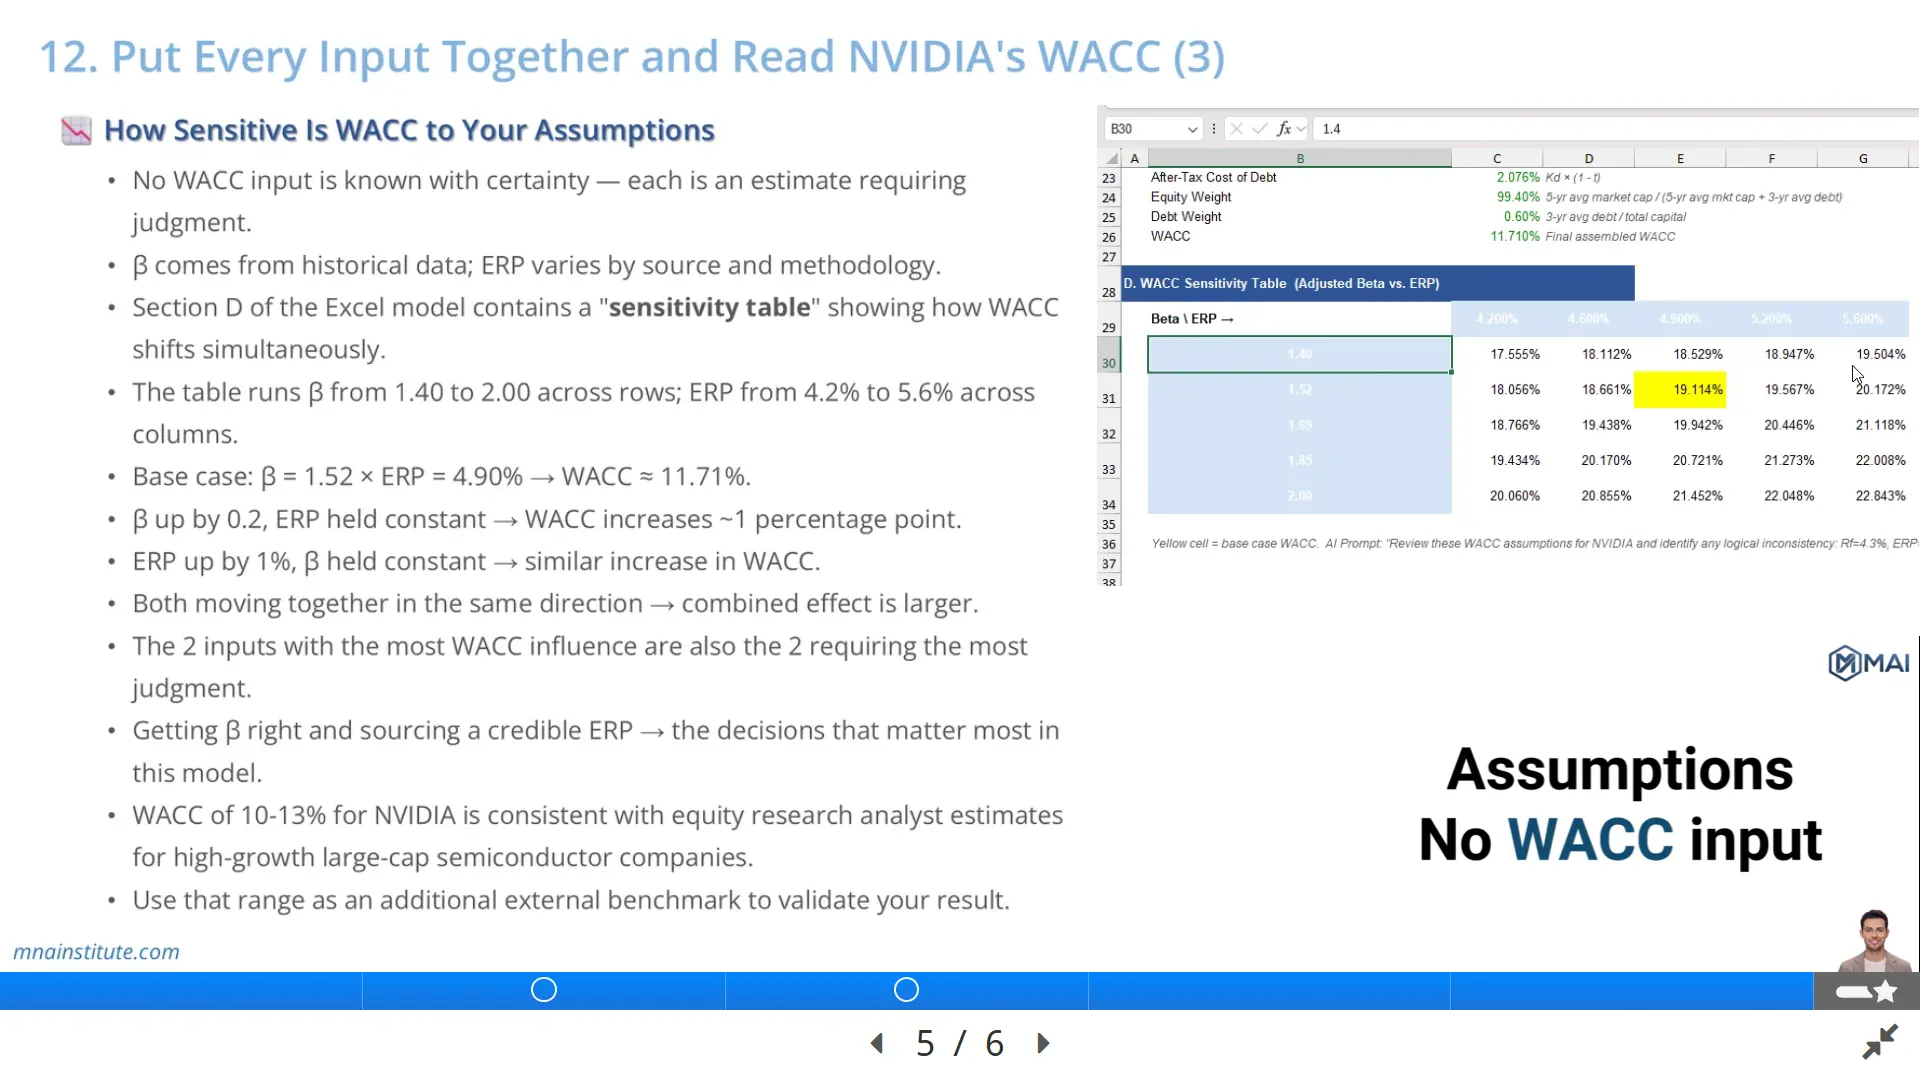
The most useful sensitivity table for NVIDIA focuses on beta and ERP because they drive almost the entire cost of equity and therefore almost the entire WACC.
The model tests adjusted beta from 1.40 to 2.00 and ERP from 4.2% to 5.6%.
The base case sits at beta of 1.52 and ERP of 4.90%, producing a WACC of approximately 11.71%.
If beta rises while ERP stays constant, WACC increases because investors require more return for higher market sensitivity.
If ERP rises while beta stays constant, WACC also increases because the market-wide equity risk premium has become more expensive.
If both move upward together, the effect compounds.
That is why sensitivity analysis is not optional.
It shows whether the WACC calculation depends on one fragile assumption.
For NVIDIA, a WACC range around 10% to 13% can be defensible depending on beta and ERP assumptions.
The base case of 11.71% sits inside that range and is therefore not obviously inconsistent with a high-growth, large-cap semiconductor company.

Two Questions WACC Actually Answers
WACC is not only a DCF discount rate.
It answers two practical corporate finance questions.
First, does the company create value with the capital already deployed in the business.
Second, does a new investment project generate enough return to justify the capital it requires.
The first question uses ROIC vs WACC.
The second question uses WACC as a hurdle rate.
These two applications are related, but they are not identical.
ROIC examines existing invested capital.
The hurdle rate examines incremental future investment.
A company can have very high historical ROIC but still reject a new project if that specific project does not clear the hurdle rate.
This distinction prevents analysts from assuming that a great company automatically has great investment opportunities.
The discipline is simple.
- ROIC > WACC: value creation
- ROIC < WACC: value destruction
- IRR > WACC: invest
- IRR < WACC: do not invest
The result is a more useful valuation framework.
WACC calculation tells the analyst the cost of capital.
ROIC calculation tells the analyst whether the operating business clears that cost.
IRR comparison tells the analyst whether new capital should be deployed.

ROIC Calculation and NVIDIA’s Value Creation Spread
ROIC stands for return on invested capital.
It measures the after-tax operating return that a company generates from the capital committed to the business.
The formula is:
ROIC = NOPLAT / Invested Capital
NOPLAT means Net Operating Profit Less Adjusted Taxes.
NOPLAT = EBIT × (1 – t)
Invested capital is the capital deployed into the operating business.
A practical approximation is:
Invested Capital = Total Assets – Non-Interest-Bearing Current Liabilities
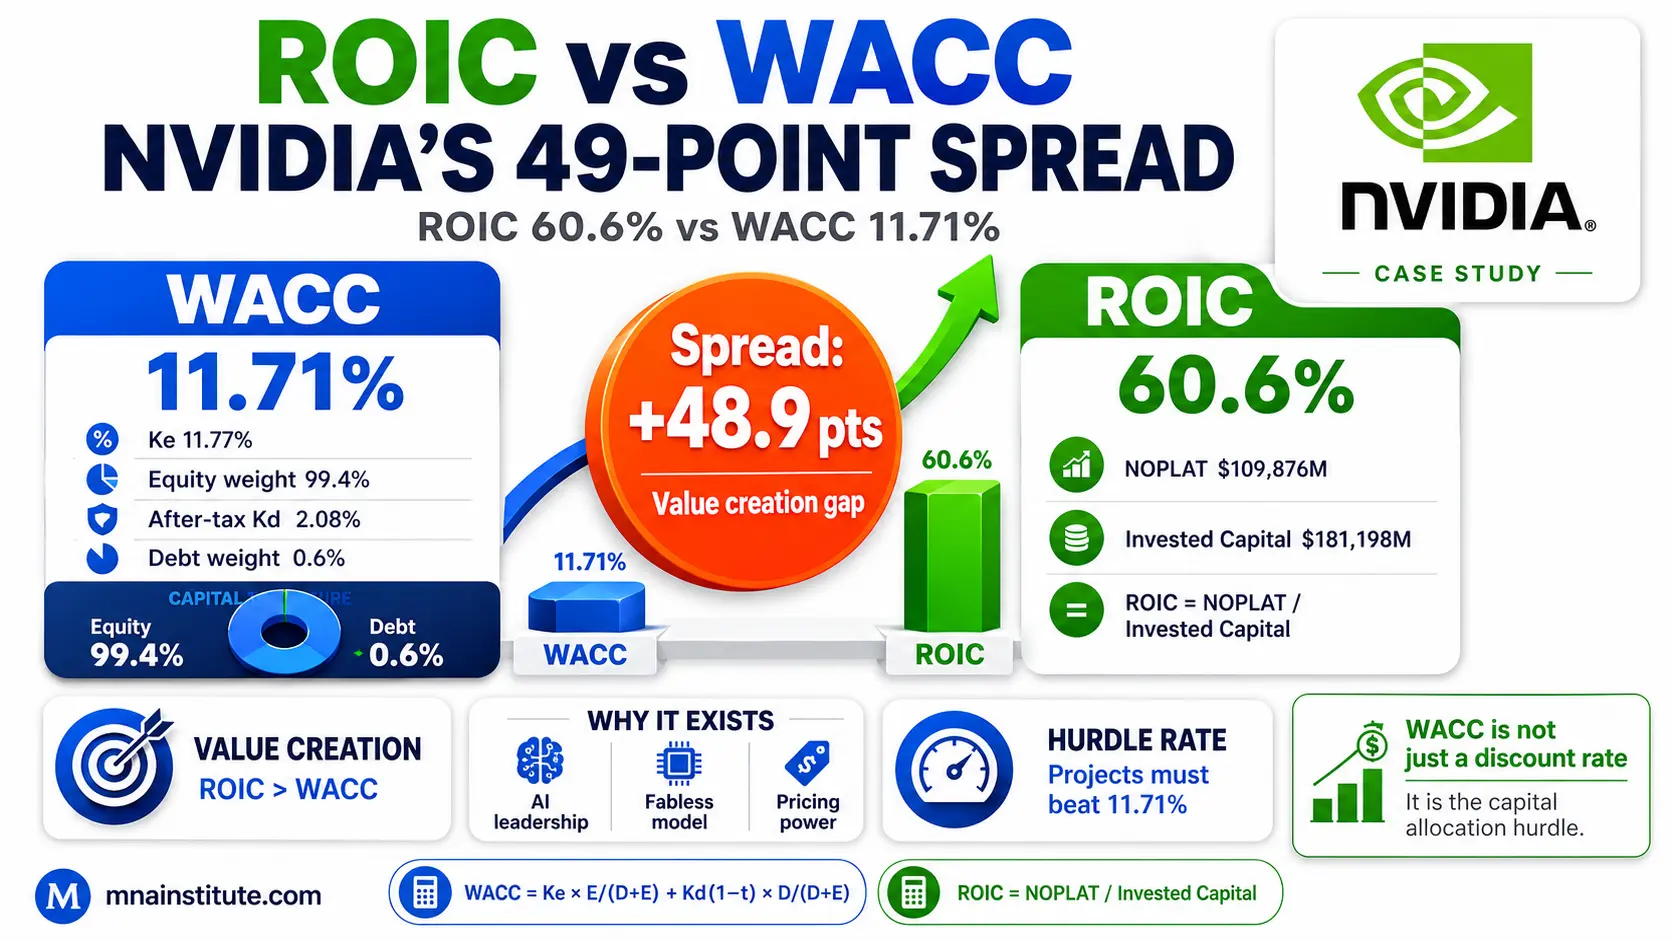
For NVIDIA FY2026, the lesson uses EBIT of $129,418 million.
Applying the 15.1% effective tax rate gives NOPLAT of approximately $109,876 million.
Invested capital is estimated at $181,198 million, based on total assets of $206,803 million minus non-interest-bearing current liabilities of $25,605 million.
The ROIC calculation is:
- ROIC = $109,876M / $181,198M
- ROIC = 60.6%
NVIDIA’s WACC is 11.71%.
The ROIC vs WACC spread is:
- ROIC – WACC = 60.6% – 11.71%
- ROIC – WACC = 48.89%
This spread means NVIDIA is earning far more on its invested capital than its blended cost of capital.
Every $1 of invested capital generates a return roughly 5× higher than the required return implied by WACC.
That is a powerful economic signal.
It helps explain why the market assigns substantial value to the company when investors believe those returns can persist.
The analyst should still ask whether the spread is sustainable.
A very wide spread can compress if competition rises, pricing power declines, supply constraints ease, or capital intensity increases.
The current ROIC vs WACC spread is therefore not the final answer.
It is the starting point for testing the durability of value creation.

Using WACC as a Hurdle Rate for New Projects
The hurdle rate applies WACC to a specific investment decision.
For a project with average business risk, WACC can serve as the minimum acceptable return.
For a project riskier than the core business, the hurdle rate should be higher than WACC.
For a lower-risk project, the hurdle rate may be lower.
This matters because a project can look attractive in accounting terms while still failing to create shareholder value.
Consider a hypothetical NVIDIA project to build a new AI data centre cluster.
The initial investment is $5 billion.
Estimated annual incremental NOPLAT is $722 million.
Annual depreciation is $350 million.
Ongoing maintenance CapEx is $200 million.
Annual free cash flow is therefore $872 million for ten years, with residual value of $500 million at the end.
The project IRR is approximately 11.1%.
NVIDIA’s WACC is 11.71%.
The decision logic is:
- IRR = 11.1%
- WACC = 11.71%
- IRR < WACC
- Decision = No-Go
The project is not rejected because it has no earnings.
It is rejected because it does not earn enough relative to the capital it consumes.
This is the discipline WACC enforces.
Capital should not flow to projects that only look profitable.
Capital should flow to projects that clear the cost of capital on a risk-adjusted basis.
That is why WACC calculation becomes most useful when it is connected to ROIC, IRR, and real investment decisions.
A second reason the WACC calculation matters is that it forces the analyst to separate operating performance from financing structure.
Operating performance shows up in margins, growth, tax-adjusted profit, working capital needs, and reinvestment discipline.
Financing structure shows up in the mix of equity and debt used to fund those operations.
A business can be operationally excellent but still use a financing structure that increases risk.
A business can also carry low debt but still have a high WACC if equity investors demand a large return because the operating outlook is volatile.
This is why the WACC equation should be read as a bridge between capital markets and operating economics.
In NVIDIA’s case, the market value equity weight dominates the WACC calculation, so the model is effectively asking what return equity investors require for exposure to a high-growth semiconductor platform.
That framing is more useful than treating WACC as a percentage copied from a database.
The analyst should be able to explain why the equity component dominates, why the debt component is small, and why the resulting 11.71% rate is reasonable for the risk profile being valued.
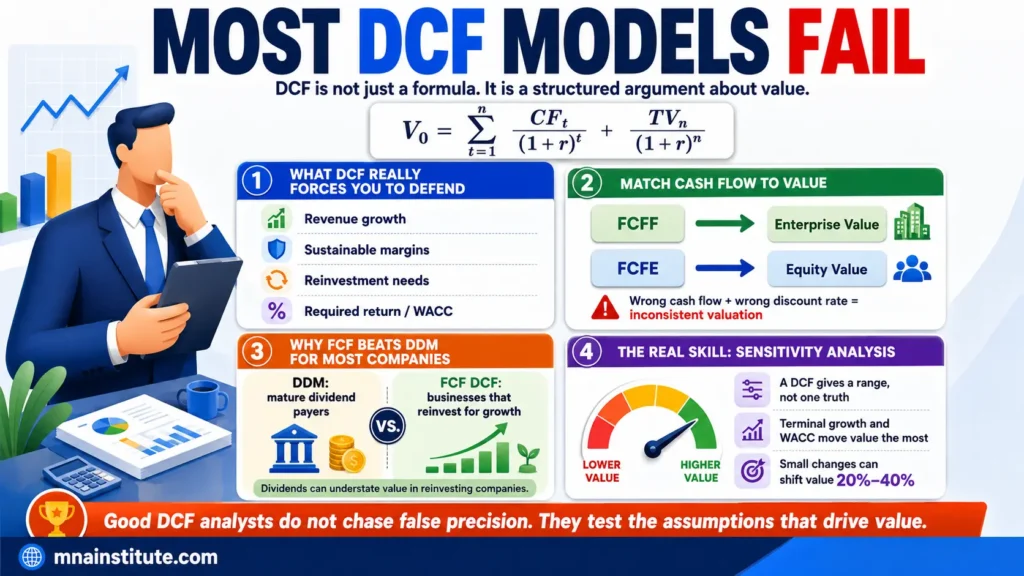
A third reason to connect WACC calculation with ROIC is that it prevents a false sense of precision.
A DCF can show a precise implied share price, but the real economic question is whether the company can keep earning returns above the required rate.
If the spread is durable, growth compounds value.
If the spread collapses, growth can add revenue while destroying economic value.
That distinction is the heart of value creation analysis.
The same logic applies to capital budgeting.
A project should not be accepted because it increases revenue or accounting profit.
It should be accepted only when its IRR exceeds the appropriate hurdle rate after adjusting for risk.
For a project with average NVIDIA business risk, the 11.71% WACC can be used as the starting hurdle rate.
For a project exposed to unfamiliar markets, untested technology, or regulatory uncertainty, the hurdle rate should move above WACC.
For a lower-risk maintenance project, the hurdle rate may sit below the company-level WACC.
This is also where AI can be useful without becoming dangerous.
AI can help summarize peer leverage, capital intensity, recent analyst commentary, and industry cyclicality before the analyst sets a project-specific hurdle rate.
The final decision should still be documented by the analyst because the model must survive review by a CFO, investment committee, or deal team.
A disciplined WACC calculation should therefore be reviewed at three levels.
First, the WACC calculation must be arithmetically correct.
Second, the WACC calculation must be sourced and explainable.
Third, the WACC calculation must lead to a decision about value creation, capital allocation, or project approval.
When the final article says WACC calculation, it therefore means more than mechanical arithmetic.
It means sourcing the inputs, assembling the equation, reading the ROIC vs WACC spread, testing sensitivity, and applying the result to real investment decisions.
Related Courses
The valuation workflow discussed in this article sits inside a broader analyst training path.
- The Financial Modeling and Valuation Course with AI and Excel connects financial statement analysis, 3-statement modeling, WACC, DCF, CCA, sensitivity analysis, and valuation report writing into one investment valuation workflow.
- The Financial Statement Analysis Course with AI for Equity Research supports the earlier work needed to read filings, calculate ratios, assess cash conversion, and identify valuation-ready signals.
- The 3-Statement Financial Modeling Course with AI connects business research to forecast assumptions, schedules, EPS, EBITDA, FCF, and model verification.
- The Mergers and Acquisitions Online Course, M&A Due Diligence Course, and Post Merger Integration Course extend the valuation work into deal screening, transaction judgment, and post-close value creation.
Sources
- CFA Institute – Cost of Capital: Advanced Topics
- McKinsey – How to Choose Between Growth and ROIC
- NVIDIA – FY2026 Financial Results
- NVIDIA Investor Relations – SEC Filings