Degree of Operating Leverage (DOL) Formula
A margin forecast looks simple until revenue starts moving faster than the cost base.
That is the moment when the degree of operating leverage becomes more than a textbook formula.
It explains why a company can grow revenue by 10% but grow operating income by far more than 10%.
It also explains why the same company can suffer a sharp earnings decline when revenue weakens.
The lesson is not that fixed costs are good or bad.
The lesson is that cost behavior must be understood before an analyst projects gross margin, operating margin, valuation multiples, or downside risk.
Microsoft provides a useful example because its income statement separates product revenue, service revenue, cost of revenue, and operating expenses in enough detail to read the cost structure behind the headline profit number.
This blog explains the degree of operating leverage through cost of revenue, operating expenses, fixed vs variable costs, Microsoft margin data, and valuation implications.
Quick Snapshot
|
Metric |
FY2023 |
FY2025 |
Analytical meaning |
|
Revenue |
$211.9B |
$281.7B |
Revenue growth of about 33% |
|
Operating income |
$88.5B |
$128.5B |
Operating income growth of about 45% |
|
Operating margin |
42% |
46% |
Margin expansion from scale |
|
Implied DOL |
N/A |
1.36 |
Operating income grew faster than revenue |

What Cost of Revenue Actually Covers
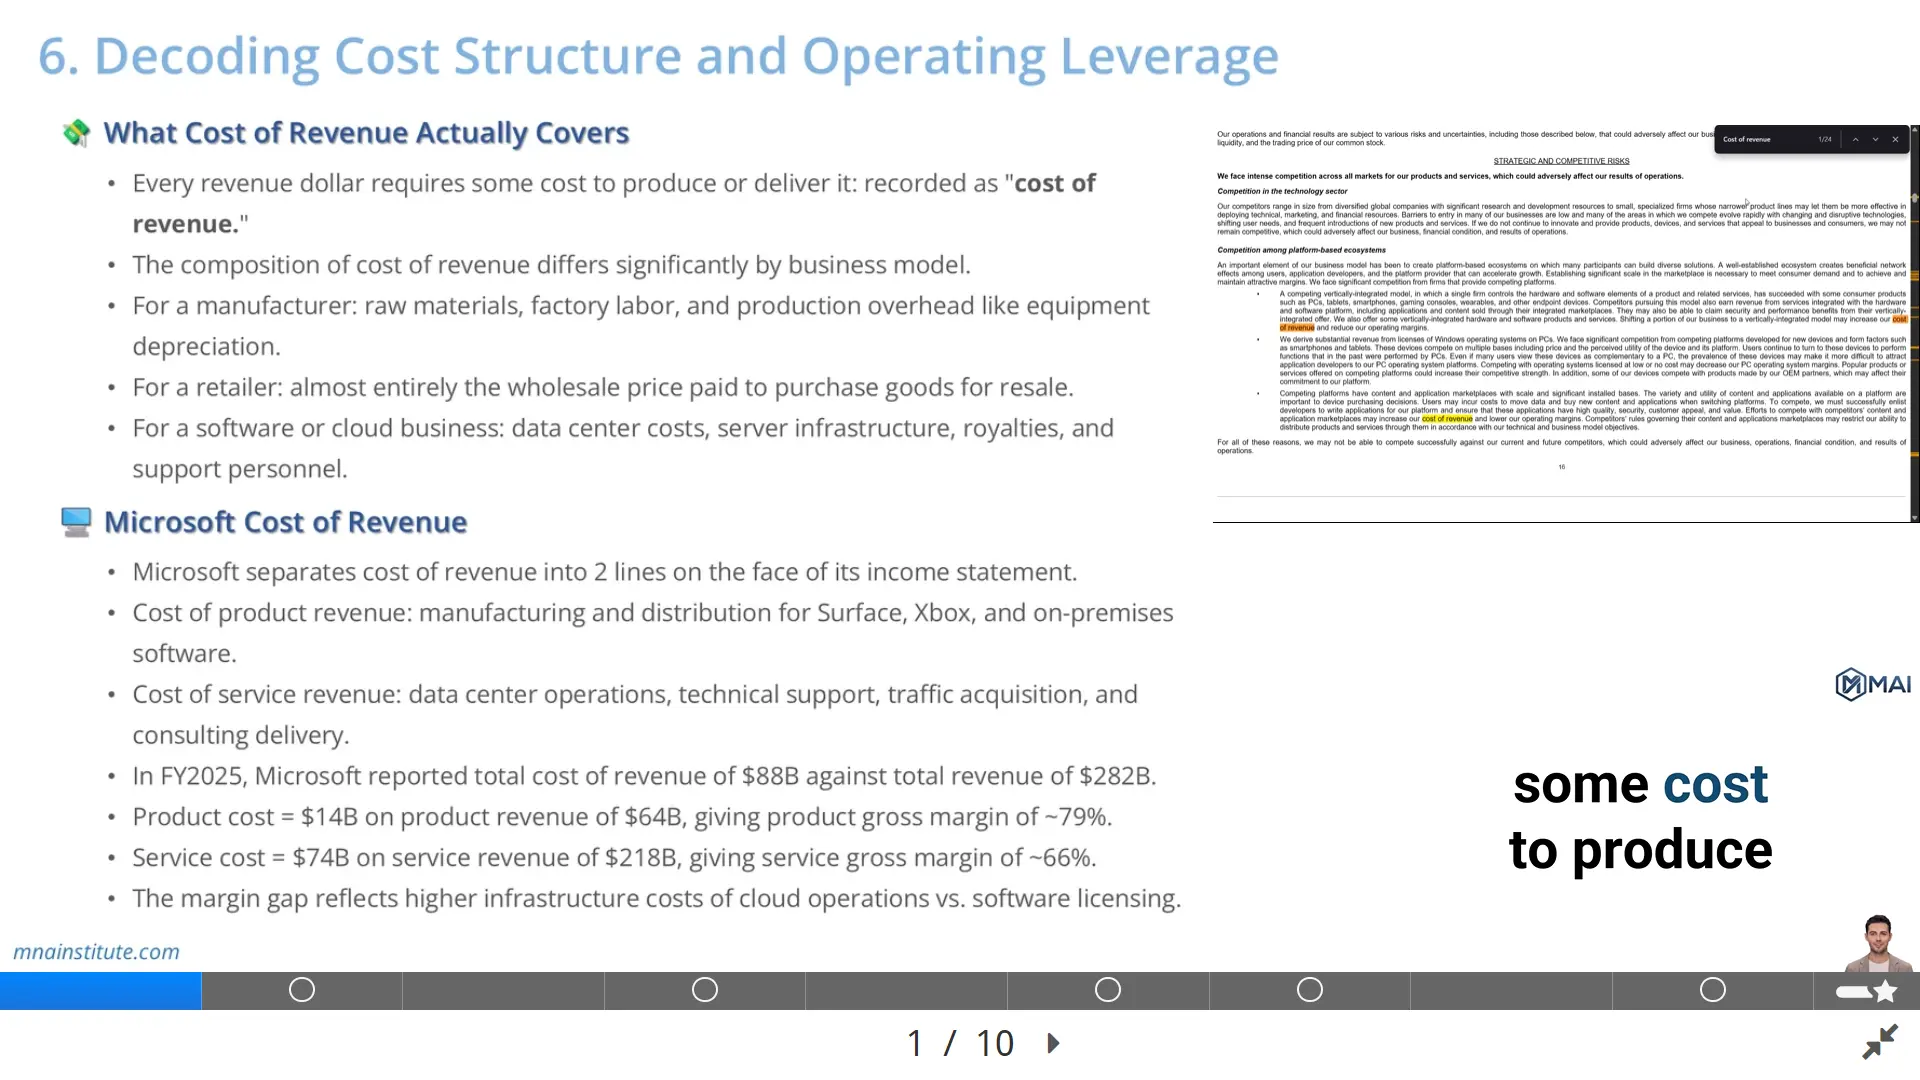
Cost of revenue is the cost directly associated with producing or delivering the revenue reported at the top of the income statement.
The SEC describes cost of goods sold as direct expenses incurred to produce products, provide services, or purchase goods for resale.
That definition sounds simple, but the actual content changes sharply by business model.
A manufacturer usually records raw materials, factory labor, quality control, production depreciation, and plant overhead inside cost of revenue.
A retailer records the wholesale cost of inventory purchased for resale, freight, fulfillment, and shrinkage if the company classifies those items in the same line.
A software company may record hosting costs, royalties, support center costs, and amortization of capitalized software once the product is ready for commercial release.
A cloud platform adds another layer because the service is delivered through data centers, networking equipment, power usage, hardware depreciation, and technical support.
That is why cost of revenue is not just an accounting line.
It is the first place where an analyst sees the economics of delivery.
If revenue grows but cost of revenue grows faster, gross margin compresses.
If revenue grows faster than cost of revenue, gross margin expands.
The degree of operating leverage begins here because gross margin determines how much revenue is left to absorb the operating expense base.
A business with high gross margin has more room for operating income expansion when revenue grows.
A business with low gross margin must generate more volume before fixed operating costs are covered.
The practical question is therefore not only how much revenue the company earned.
The practical question is how much cost was required to deliver each dollar of revenue.

Microsoft Cost of Revenue and Gross Margin
Microsoft separates product revenue from service and other revenue in its FY2025 annual report.
Product revenue includes operating systems, productivity applications, server applications, business applications, developer tools, games, and hardware such as PCs, tablets, consoles, and accessories.
Service and other revenue includes cloud-based solutions such as Office 365, Azure, Dynamics 365, gaming services, support, consulting, online advertising, and LinkedIn.
This split matters because the cost behavior is different.
In FY2025, Microsoft reported product revenue of $63.9 billion and product cost of revenue of $13.5 billion.
That produces a product gross margin of roughly 79%.
The same filing reported service and other revenue of $217.8 billion and service and other cost of revenue of $74.3 billion.
That produces a service and other gross margin of roughly 66%.
The product line carries a higher gross margin because a software license can scale with limited incremental delivery cost once the core product is built.
The service line still earns a strong gross margin, but cloud delivery requires ongoing infrastructure, data center capacity, support, traffic acquisition, and consulting delivery costs.
The difference between 79% and 66% is not a sign that cloud revenue is weak.
It shows that the revenue mix determines the cost structure behind the consolidated gross margin.
An analyst who models Microsoft with one flat cost of revenue ratio would miss this mix effect.
That error becomes larger when cloud revenue grows faster than product revenue.
The degree of operating leverage must therefore be read together with gross margin mix.
If high-margin product revenue slows while lower-margin cloud revenue accelerates, revenue growth may still be strong while gross margin pressure appears.
If cloud infrastructure efficiency improves over time, the same cloud growth can support operating margin expansion.
What Operating Expenses Reveal Below Gross Profit
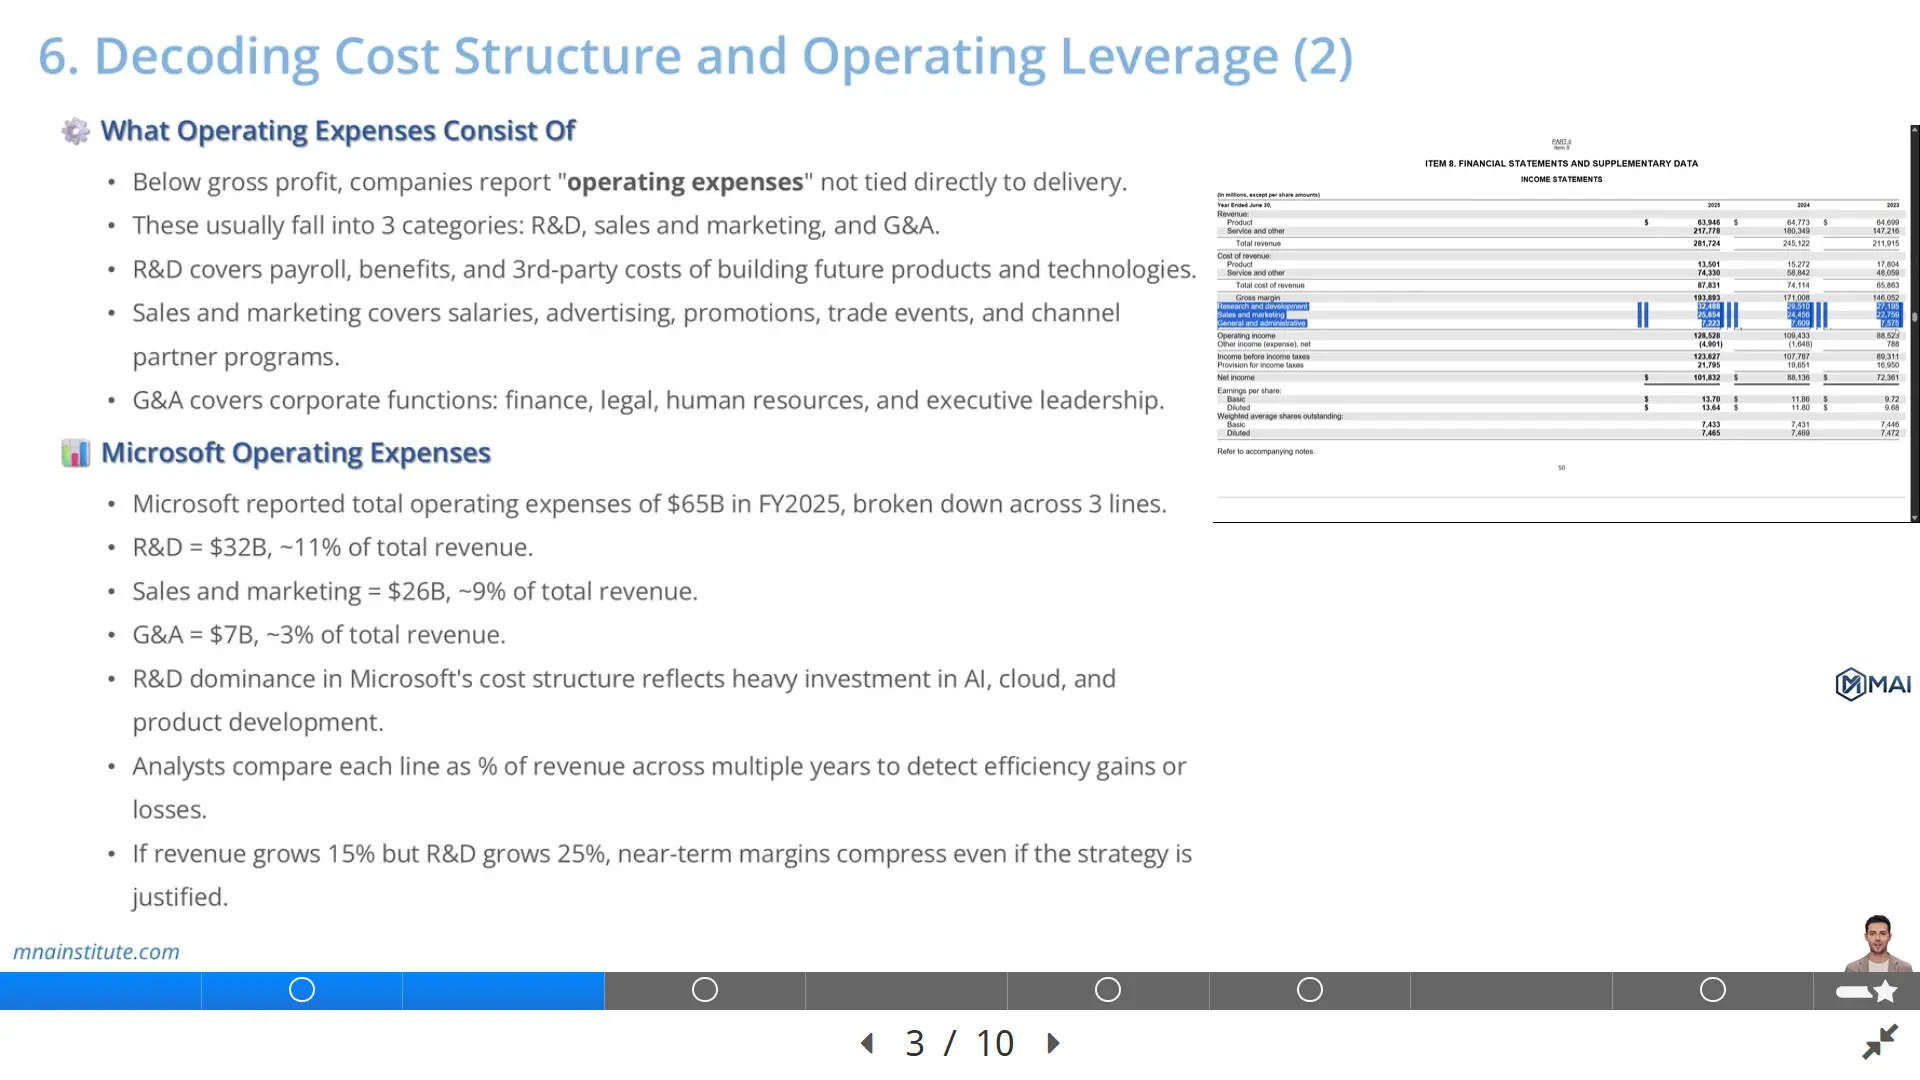
Below gross profit, operating expenses show the cost of running the business after the product or service has been delivered.
The SEC describes operating expenses as overhead costs that are not associated with producing products or providing services.
For most public companies, these expenses are grouped into research and development, sales and marketing, and general and administrative expense.
Research and development covers engineers, scientists, product managers, infrastructure for experimentation, third-party development costs, and future product investment.
Sales and marketing covers direct sales teams, channel programs, advertising, events, demand generation, and partner incentives.
General and administrative covers finance, legal, human resources, corporate technology, executive leadership, compliance, and other central functions.
These costs are not all fixed in a strict accounting sense.
Sales commissions can vary with deals closed.
Advertising can be reduced quickly if management wants to protect near-term profit.
Yet many operating expenses behave like fixed or semi-fixed costs over a short forecast period.
A company cannot instantly remove an engineering organization, reduce all office leases, or shrink enterprise support infrastructure when one quarter of revenue disappoints.
That short-term rigidity creates operating leverage.
If revenue rises, existing headcount and systems can support more sales without a proportional cost increase.
If revenue falls, those same costs remain in place and operating income declines faster than revenue.
This is why operating expenses are not just expense lines to trend mechanically as a % of revenue.
They are the operating architecture of the business.

Microsoft Operating Expenses and Efficiency Signals
Microsoft reported total operating expenses of $65.4 billion in FY2025.
Research and development was $32.5 billion, equal to about 12% of revenue.
Sales and marketing was $25.7 billion, equal to about 9% of revenue.
General and administrative was $7.2 billion, equal to about 3% of revenue.
The largest operating expense line was research and development.
Microsoft states that research and development expenses include payroll, employee benefits, stock-based compensation, headcount-related product development costs, AI training and infrastructure costs, third-party development costs, and amortization of purchased software code and service content.
This tells the analyst that a major part of Microsoft operating expense is not simply current-period selling cost.
It is investment in future product capability, cloud scale, security, AI infrastructure, and platform depth.
That distinction matters when interpreting operating leverage.
If R&D rises faster than revenue for a period, the company may be investing ahead of demand rather than losing efficiency.
If R&D grows much slower than revenue for several years, operating income may expand, but the analyst must ask whether innovation investment is being underfunded.
Sales and marketing creates a different signal.
If sales and marketing declines as a % of revenue while revenue continues to grow, the company may be benefiting from brand strength, enterprise account penetration, or cloud platform pull-through.
If sales and marketing rises faster than revenue, growth may be becoming more expensive to acquire.
General and administrative usually receives less attention, but it helps reveal corporate scale efficiency.
A mature software platform should not need corporate overhead to grow at the same pace as revenue forever.
The degree of operating leverage becomes visible when these lines are compared across several years rather than read in isolation.

Fixed vs Variable Costs in a Real Cost Structure
The core idea behind fixed vs variable costs is cost behavior.
Variable costs move broadly with revenue, usage, volume, or units sold.
Raw materials, reseller inventory costs, payment processing fees, sales commissions, cloud usage costs, and freight are common variable cost examples.
Fixed costs remain stable across a relevant range of activity.
Rent, salaried engineering teams, corporate systems, owned equipment depreciation, long-term data center commitments, and base management salaries are common fixed costs and variable costs examples are useful because they show the contrast clearly.
A business rarely has perfectly fixed or perfectly variable costs.
Most real companies have mixed costs.
A sales organization has base salaries that are relatively fixed and commissions that vary with bookings.
A cloud business has fixed data center capacity and variable consumption costs linked to customer usage.
A manufacturer has fixed plant depreciation and variable raw material costs.
A retailer has a high variable merchandise cost, but also fixed store leases, headquarters payroll, and distribution infrastructure.
This is why analysts should not classify costs based only on the income statement label.
Cost of revenue can include both variable costs and fixed infrastructure costs.
Operating expenses can include both fixed headcount and variable compensation.
The right question is how each cost behaves when revenue rises or falls.
When an analyst builds a forecast, fixed vs variable costs should be mapped line by line.
These fixed costs and variable costs examples show why the same revenue growth rate can create very different operating income outcomes.
That mapping creates the bridge from revenue growth to margin expansion, which is exactly what the degree of operating leverage measures.

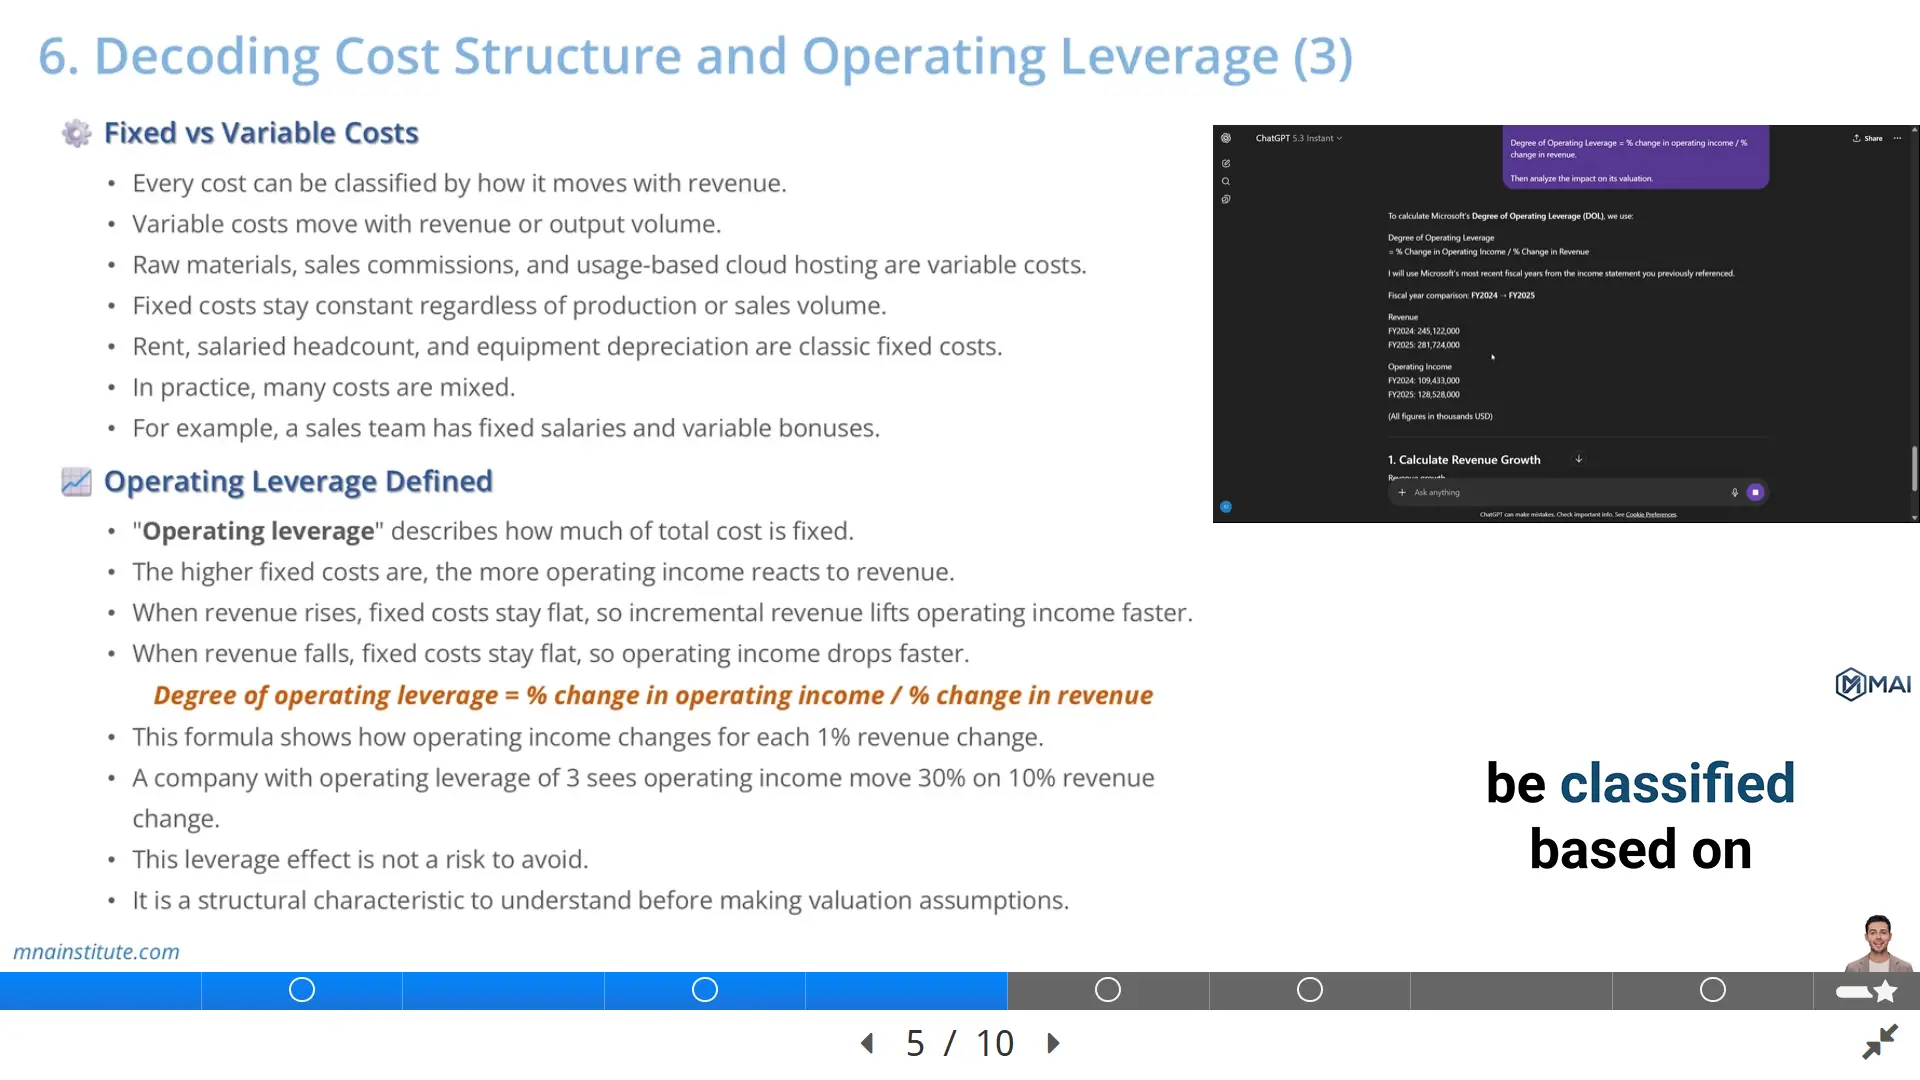
Degree of Operating Leverage Formula and How to Calculate It
The degree of operating leverage measures how sensitive operating income is to a change in revenue.
The basic operating leverage formula is simple.
Degree of Operating Leverage = % change in operating income / % change in revenue
This formula tells the analyst how many units of operating income change are created by one unit of revenue change.
- If revenue grows by 10% and operating income grows by 30%, the degree of operating leverage is 3.
- If revenue falls by 10% and operating income falls by 30%, the degree of operating leverage is also 3, but the direction is negative for earnings.
The formula can be used with EBIT, operating income, or operating profit, as long as the metric is used consistently.
The common mistake is to calculate operating leverage once and treat it as permanent.
It is not permanent.
The degree of operating leverage changes with revenue level, cost mix, pricing, capacity utilization, and management decisions.
A company near breakeven often has a very high degree of operating leverage because a small revenue increase can produce a large percentage increase in operating income.
A highly profitable company may still have strong operating leverage, but the percentage sensitivity can be lower because the operating income base is already large.
To calculate operating leverage professionally, follow a simple sequence.
- First, calculate the change in revenue over the period.
- Second, calculate the change in operating income over the same period.
- Third, divide the % change in operating income by the % change in revenue.
- Fourth, interpret the answer only after reviewing the cost structure behind it.
The degree of operating leverage should be a diagnostic tool, not a mechanical label.

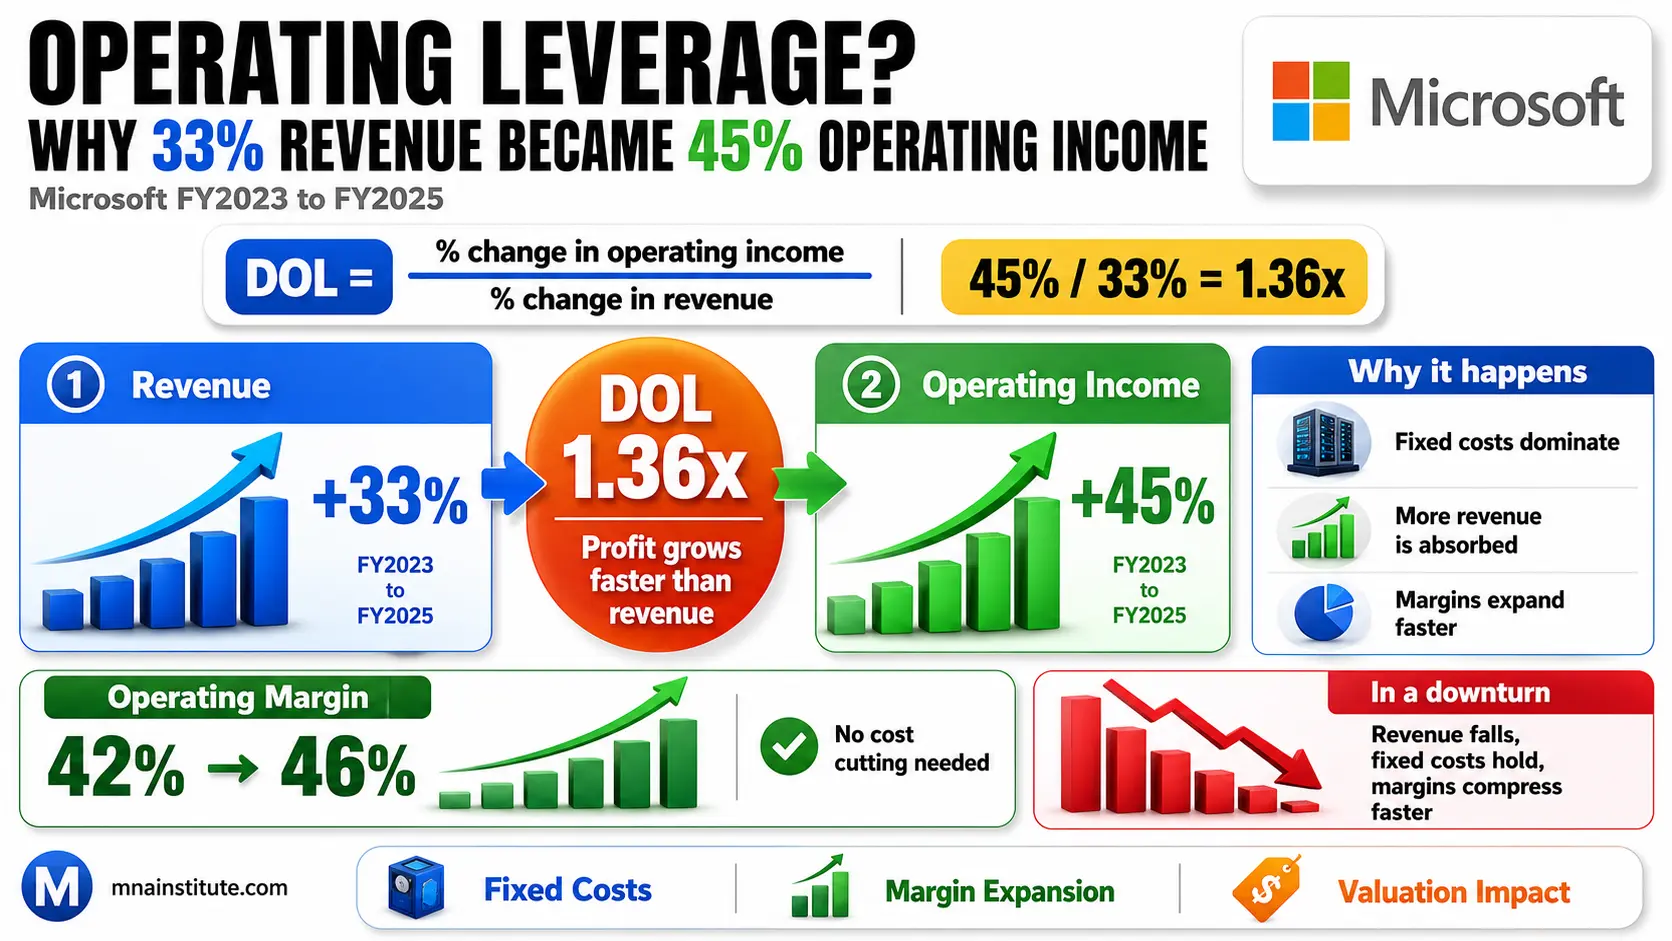
Microsoft and Operating Leverage: 33% Revenue Growth vs 45% Operating Income Growth
Microsoft illustrates the degree of operating leverage during a growth cycle.
In FY2023, Microsoft reported revenue of $211.9 billion and operating income of $88.5 billion.
In FY2025, Microsoft reported revenue of $281.7 billion and operating income of $128.5 billion.
Revenue grew by approximately 33% over those two fiscal years.
Operating income grew by approximately 45% over the same period.
The implied degree of operating leverage over this period is approximately 1.36.
Degree of Operating Leverage = 45% / 33% = 1.36
This does not mean every future 1% of Microsoft revenue growth will always create 1.36% of operating income growth.
It means that over this specific period, operating income expanded faster than revenue.
That result is consistent with a business where many costs do not rise in direct proportion to revenue.
Microsoft has large fixed and semi-fixed cost areas such as engineering headcount, product development platforms, data center assets, corporate functions, and long-term cloud infrastructure commitments.
When revenue expands, those costs can support additional scale.
The result is operating margin expansion from 42% in FY2023 to 46% in FY2025.
The same structure can create downside sensitivity.
If cloud demand slows, enterprise seat expansion moderates, or AI infrastructure spending remains high while revenue growth weakens, operating income can compress faster than revenue.
This is why the degree of operating leverage is both an upside accelerator and a downside warning system.
The analyst should not praise high operating leverage without also testing the revenue downside case.

Impact on Valuation and Forecasting
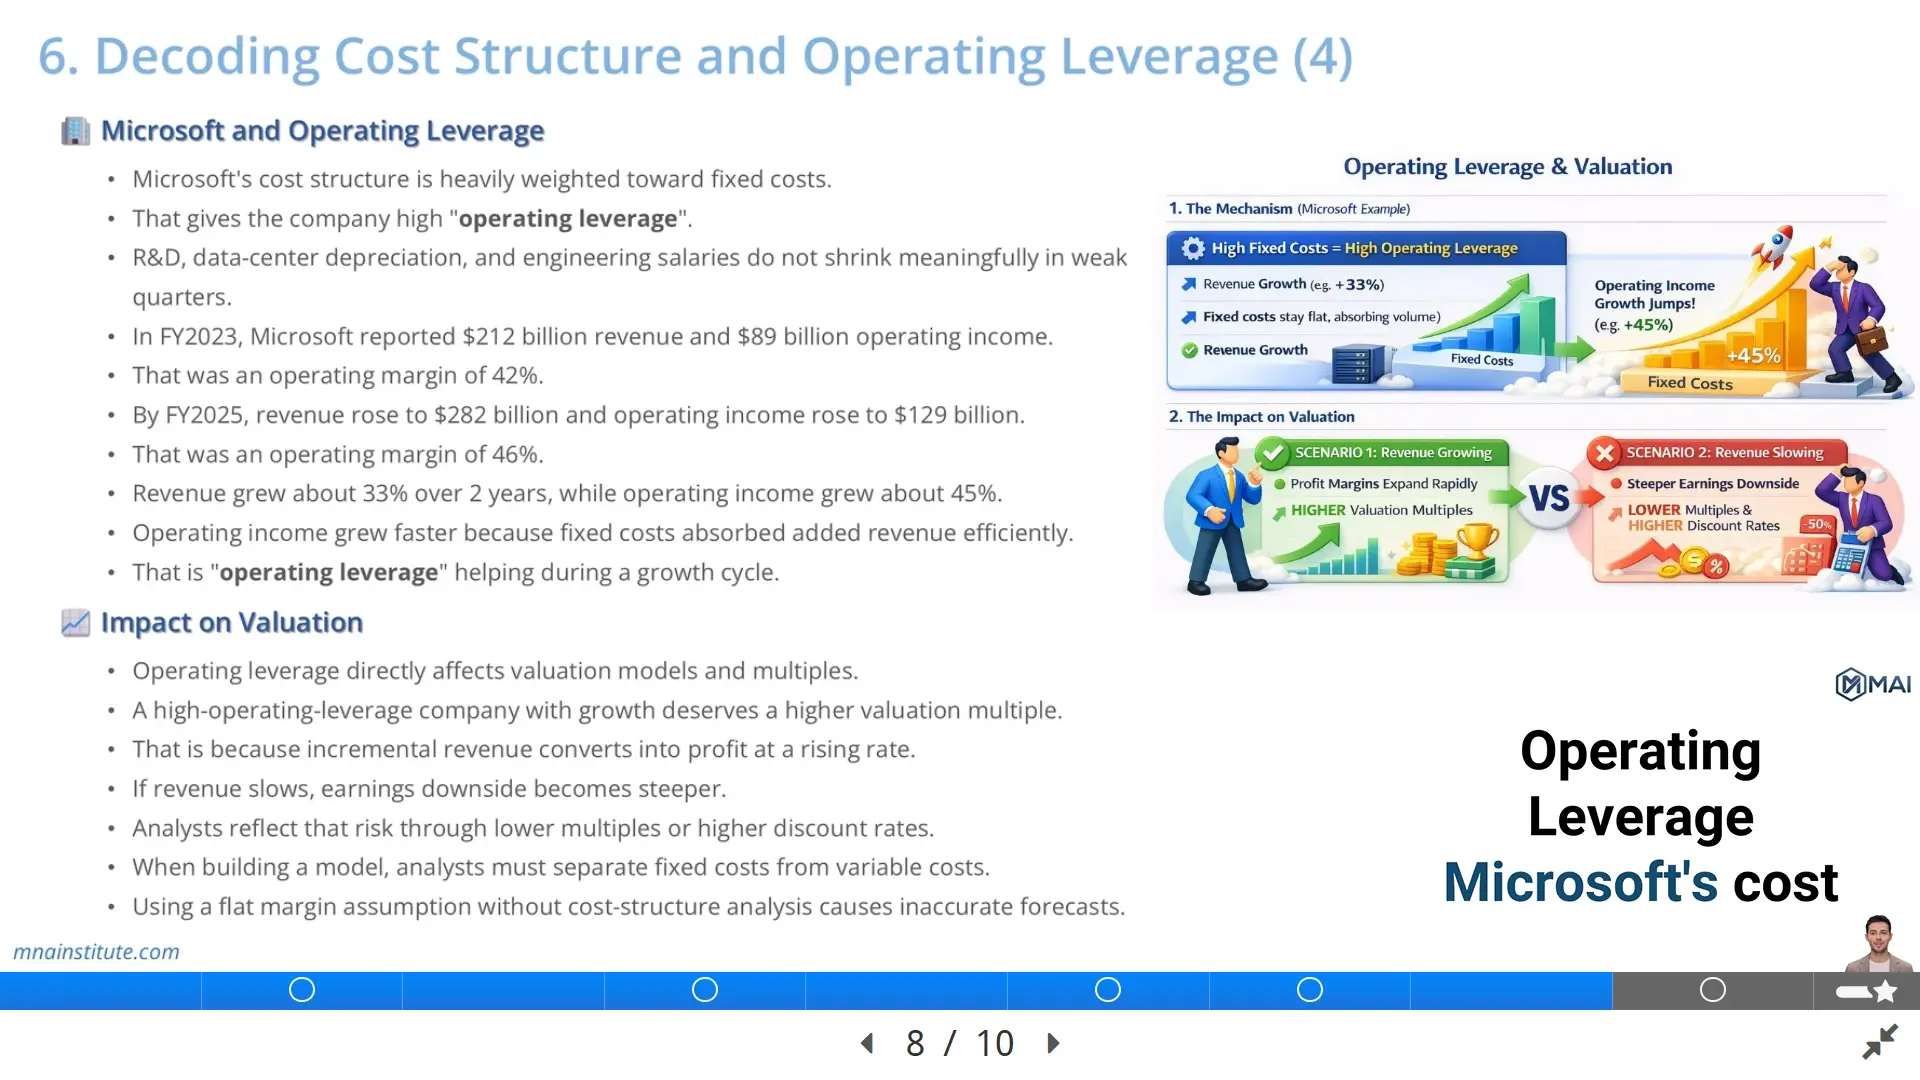
Operating leverage directly affects valuation because valuation models translate revenue into future operating income and free cash flow.
A company with high operating leverage and expanding revenue can produce margin expansion without needing every cost line to grow at the same rate as sales.
That margin expansion raises projected EBIT, NOPLAT, free cash flow, and enterprise value.
This is one reason high-quality software and cloud businesses can trade at premium valuation multiples when revenue growth is durable.
The market is not only paying for current revenue.
It is paying for the expectation that incremental revenue will convert into profit and cash flow at attractive rates.
The reverse is also true.
A high-operating-leverage company facing a revenue slowdown may deserve a lower multiple because the earnings downside is steeper.
A flat margin assumption can therefore be dangerous.
It hides the operating leverage formula inside a shortcut.
When revenue grows, a flat margin assumption may understate upside if fixed costs are already in place.
When revenue falls, a flat margin assumption may understate downside if fixed costs cannot be reduced quickly.
A better model separates revenue drivers, cost of revenue, R&D, sales and marketing, general and administrative expense, and depreciation.
Then the analyst decides which lines are variable, which lines are fixed, and which lines are mixed.
The model should also test multiple revenue scenarios.
Base case revenue growth may support operating margin expansion.
Downside revenue growth may expose margin compression.
Upside revenue growth may show operating income acceleration.
This is the practical use of the degree of operating leverage.
It turns cost structure into a valuation judgment rather than a static ratio.
Related Courses
- The Financial Modeling and Valuation Course with AI and Excel is the most direct next step for readers who want to translate cost structure into revenue forecasts, margin schedules, DCF models, and valuation outputs.
- The Financial Statement Analysis Course with AI for Equity Research is useful when the focus is reading income statement disclosures, cost behavior, and profitability trends before building a model.
- The 3-Statement Financial Modeling Course with AI connects income statement assumptions to the balance sheet and cash flow statement, which is essential when operating leverage affects EBIT, tax, working capital, and free cash flow.
- The M&A Due Diligence Course is relevant when operating leverage must be tested before acquisition pricing, synergy estimates, downside cases, and investment committee recommendations.
Sources
- Microsoft Annual Report 2025
- Microsoft FY2025 Form 10-K on SEC EDGAR
- CFA Institute, Company Analysis: Past and Present
- SEC, What is an Income Statement?