How to Calculate Operating Cash Flow from Net Income
Many analysts start with net income because it is the final profit number on the income statement.
That is a reasonable starting point, but it is not the same as cash generated by the business.
A company can report high net income while cash is trapped in receivables, inventory, or delayed customer collections.
A company can also report lower profit while producing strong cash because depreciation, amortization, and stock-based compensation reduce accounting earnings without immediately taking cash out of the bank.
This is why the cash flow statement begins with net income and then reconciles it into cash flow from operations.
The practical question is not whether the company was profitable under accrual accounting.
The practical question is whether that profit became cash that management can reinvest, use to repay debt, return to shareholders, or deploy into acquisitions.
This article explains how to calculate operating cash flow from net income using Microsoft fiscal year 2025 as the working example.
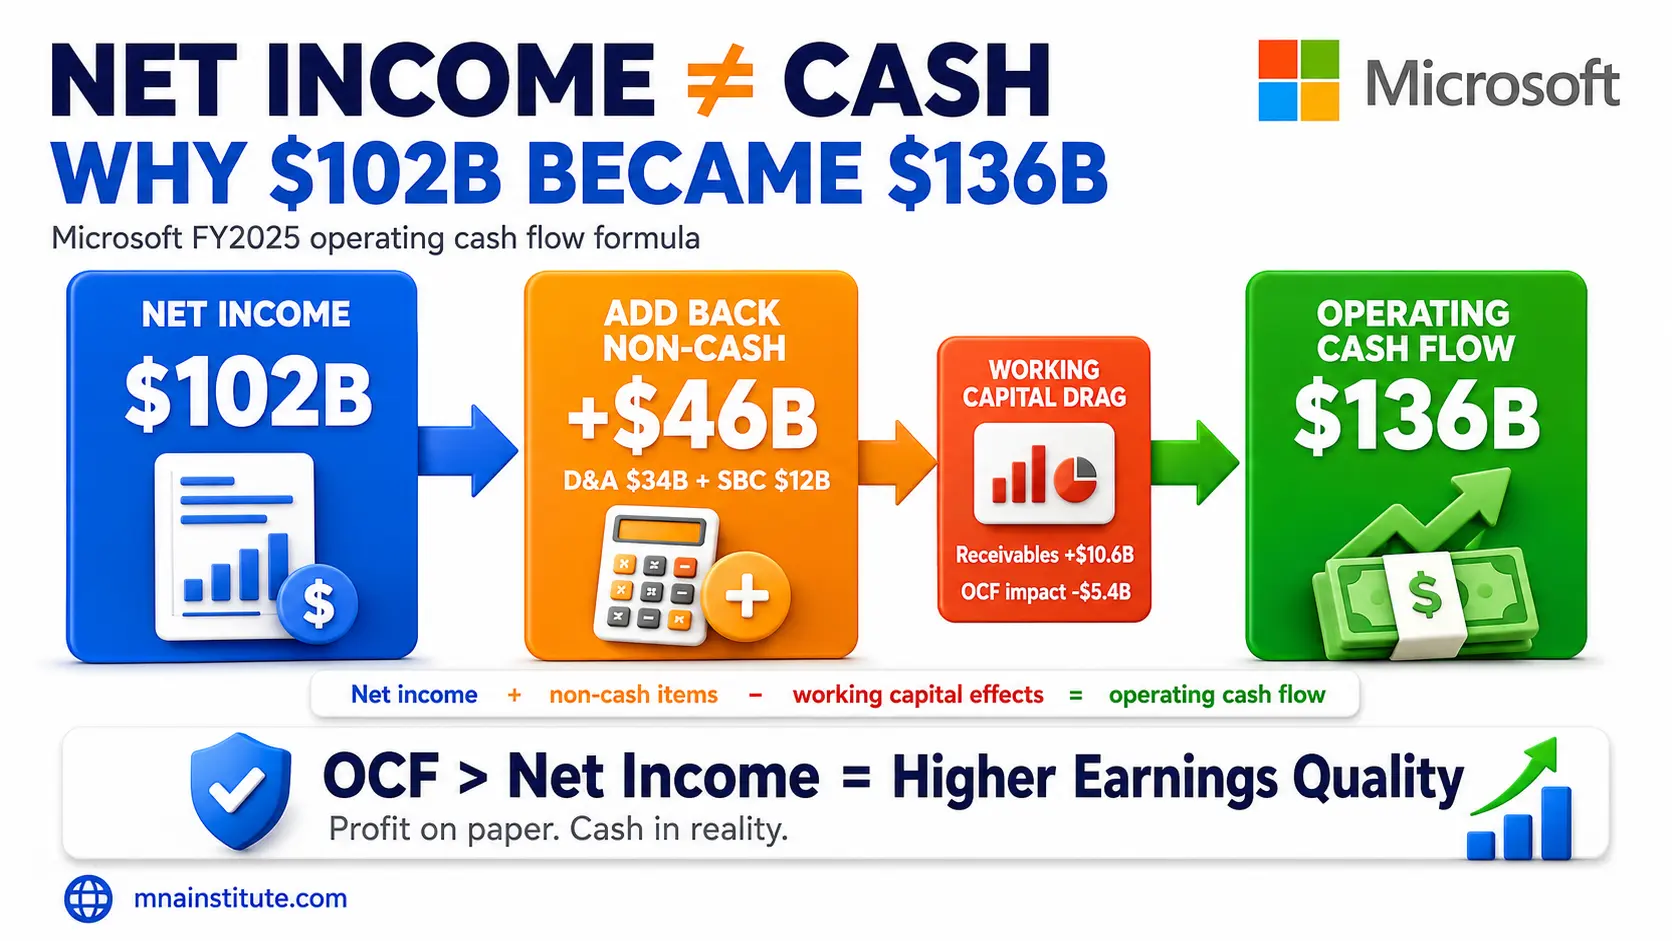
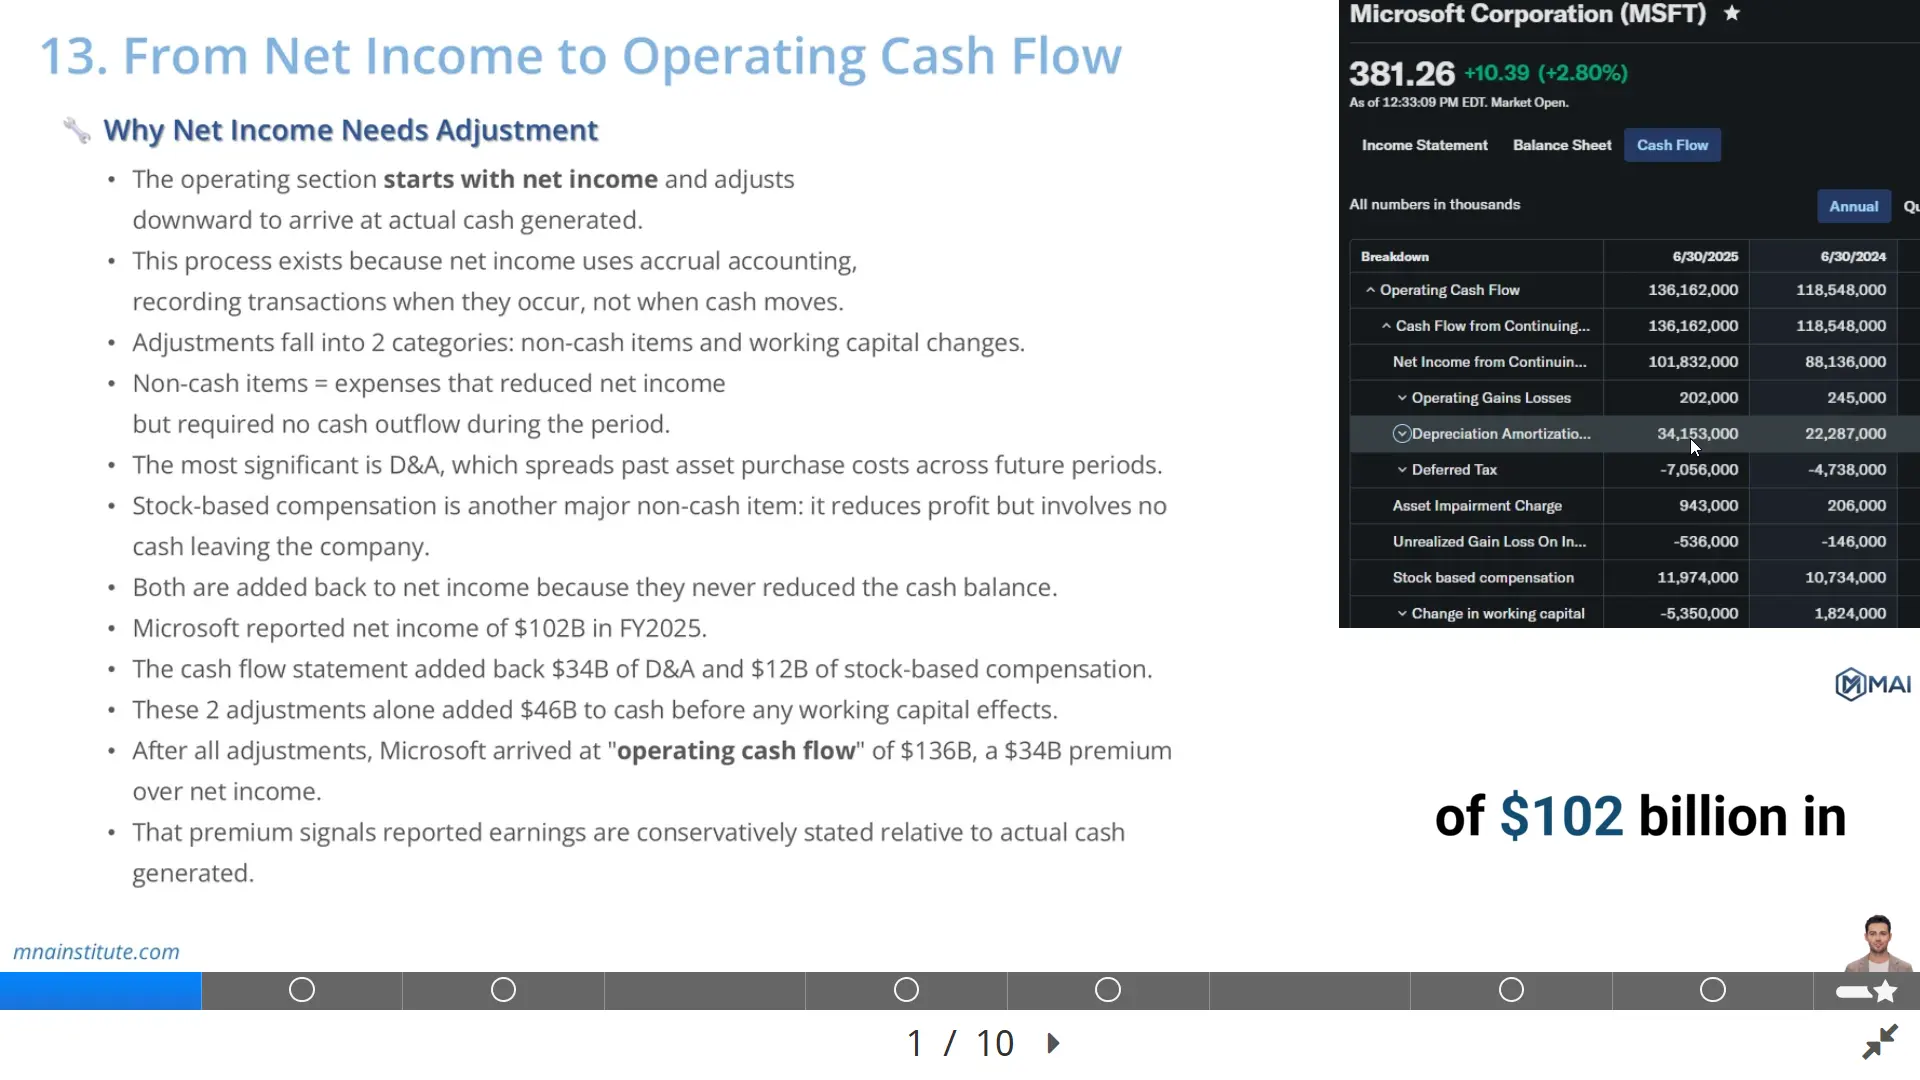
Microsoft reported $101.8B of net income and $136.2B of net cash from operations, which means cash generation exceeded reported profit by about $34.3B.
That bridge is the reason operating cash flow is one of the first numbers analysts check before trusting earnings quality.

Why Net Income Is Not the Same as Operating Cash Flow
Net income is calculated under accrual accounting, so it records revenue and expenses when they are earned or incurred, not necessarily when cash moves.
That accounting logic creates a useful measure of period profit, but it also means net income can contain timing differences and non-cash expenses.
Operating cash flow corrects for those differences by asking a narrower question.
How much cash did the core business actually generate during the period?
The answer begins with net income, then adjusts for items that affected reported profit without changing cash, and then adjusts for operating balance sheet movements.
This is the indirect method, and it is the method most large U.S. public companies use in their cash flow statements.
The operating cash flow formula can be simplified as follows.
Operating Cash Flow = Net Income + Non-Cash Add-Backs ± Changes in Working Capital
The formula is simple, but the interpretation is not mechanical.
A positive add-back does not automatically mean higher business quality.
A working capital drain does not automatically mean the business is deteriorating.
The analyst must read each adjustment in the context of the business model, revenue growth, customer payment terms, supplier terms, and capital intensity.
That is why learning how to calculate operating cash flow is not just an accounting exercise.
Analysts learn how to calculate operating cash flow because they need a disciplined bridge from reported profit to cash generation.
The phrase may sound technical, but the logic is direct: start with profit, remove accounting noise, and measure cash created by operations.
It is a way to test whether reported profit is backed by cash.

How to Calculate Operating Cash Flow Using the Indirect Method
The operating section of the cash flow statement follows a structured bridge from accounting profit to cash generation.
The first line is net income.
The next group adds back non-cash expenses or subtracts non-cash gains.
The final group adjusts for changes in operating assets and operating liabilities.
For a beginner, the easiest way to remember the operating cash flow formula is to separate the bridge into three layers.
- Start with net income from the income statement.
- Add back non-cash charges that reduced profit but did not use cash.
- Adjust for working capital movements that changed cash timing.
This structure explains how to calculate cash flow from operations without confusing accounting recognition with cash movement.
When analysts explain how to calculate operating cash flow, they usually begin here because each line in the bridge has a clear cash logic.
The cleanest workflow is to tag every adjustment as a non-cash item, an operating asset movement, or an operating liability movement.
This is also the simplest answer to how to calculate cash flow from operations under the indirect method.
Depreciation and amortization are added back because they allocate the cost of assets purchased in earlier periods.
Stock-based compensation is added back because the company records an expense even though the cash payment does not leave the business in that period.
Deferred taxes, impairment charges, investment gains, and investment losses may also appear in the bridge depending on the company.
Working capital then captures whether sales have been collected, suppliers have been paid, inventory has been purchased, and deferred revenue has changed.
The same operating cash flow formula can therefore produce very different messages for different companies.
That is why how to calculate operating cash flow depends on the business model as well as the accounting statement.
A subscription software company, a retailer, a manufacturer, and a bank will not have the same cash conversion pattern.
Non-Cash Add-Backs: Depreciation, Amortization, and Stock-Based Compensation
The first major adjustment from net income to operating cash flow is the non-cash add-back.
A practical way to learn how to calculate operating cash flow is to ask whether each expense reduced cash during the same period.
Non-cash expenses reduce reported profit, but they do not reduce cash in the same period.
Depreciation and amortization are the most common examples.
Depreciation spreads the cost of tangible assets over their useful lives.
Amortization spreads the cost of intangible assets over their useful lives.
The original cash outflow usually happened when the asset was purchased or acquired.
The later expense is an accounting allocation, not a new cash payment.
Microsoft reported depreciation, amortization, and other of $34.153B in fiscal year 2025.
That amount reduced Microsoft earnings in the income statement, but the cash had not left the business in fiscal year 2025 as a new operating cash cost.
It was therefore added back in the cash flow statement.
Stock-based compensation works differently but also creates an add-back.
Microsoft reported $11.974B of stock-based compensation expense in fiscal year 2025.
This expense reduced net income, but it did not require the company to pay cash to employees at that moment.
The cash flow statement therefore added it back when reconciling net income to operating cash flow.
These two items alone added about $46.1B to Microsoft cash flow before working capital effects.
This does not mean depreciation or stock-based compensation should be ignored in valuation.
Depreciation reflects assets that must eventually be replaced, and stock-based compensation dilutes shareholders over time.
The narrow cash flow point is that neither item reduced the current period cash balance in the same way as wages, rent, taxes, or supplier payments.
This is also why how to calculate operating cash flow must be separated from how to judge long-term shareholder dilution or asset replacement needs.

Working Capital Changes and Cash Flow Timing
The second major adjustment is working capital.
Working capital is the part of how to calculate operating cash flow that most often changes the analyst’s interpretation of growth.
Working capital captures the timing gap between when accounting profit is recognized and when operating cash actually moves.
The core operating working capital accounts are accounts receivable, inventory, accounts payable, accrued expenses, and deferred or unearned revenue.
The direction of each change matters.
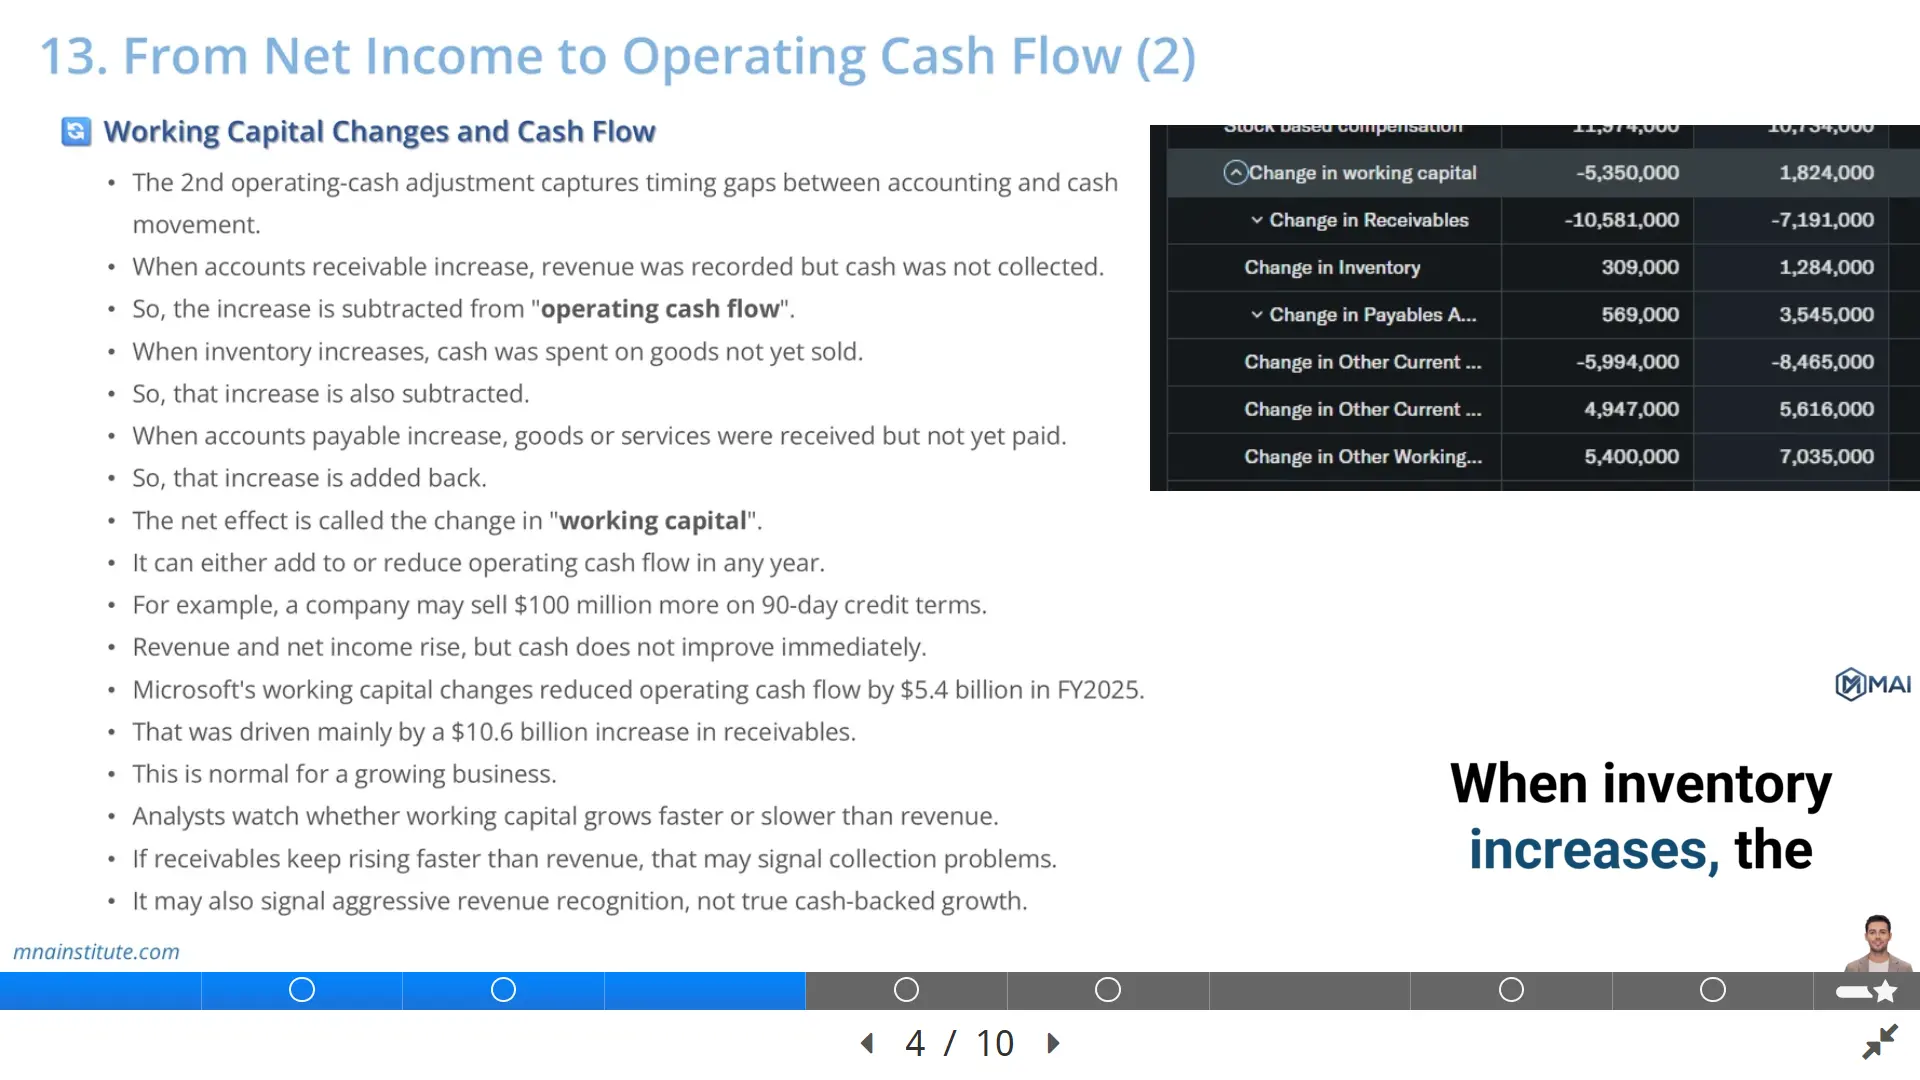
- An increase in accounts receivable is a use of cash because the company recorded revenue before collecting cash.
- An increase in inventory is a use of cash because the company paid for goods that have not yet been sold.
- An increase in accounts payable is a source of cash because the company received goods or services before paying suppliers.
- An increase in unearned revenue is usually a source of cash because customers paid before the company recognized all revenue.
For example, assume a software company signs $100M of new annual contracts and invoices customers on 90-day payment terms.
Revenue may rise quickly, but cash will not arrive until customers pay their invoices.
The income statement can show growth before the bank account receives the cash.
That gap shows up as an increase in accounts receivable, which reduces operating cash flow.
Microsoft had a $10.581B increase in accounts receivable in fiscal year 2025, which reduced operating cash flow.
The total movement in operating assets and liabilities reduced cash flow by about $5.35B.
That drag was not automatically negative because Microsoft was growing rapidly.
The question is whether working capital grows in line with revenue or grows faster than the business can justify.
This is why how to calculate operating cash flow should always include a revenue growth check against receivables, inventory, payables, and deferred revenue.
If receivables consistently grow much faster than revenue, analysts investigate customer quality, billing terms, collection discipline, and revenue recognition risk.

How to Calculate Operating Cash Flow in Microsoft’s FY2025 Example
The Microsoft fiscal year 2025 cash flow statement gives a clean example of how to calculate operating cash flow from net income.
It also shows how to calculate operating cash flow with real filing data rather than a classroom shortcut.
- The company started with net income of $101.832B.
- It added back $34.153B of depreciation, amortization, and other.
- It added back $11.974B of stock-based compensation.
- It recorded $609M of recognized losses on investments and derivatives, which also increased the reconciliation from accounting profit to operating cash flow.
- It then subtracted $7.056B for deferred income taxes.
After these non-cash and tax timing adjustments, Microsoft moved through operating assets and liabilities.
- Accounts receivable reduced operating cash flow by $10.581B.
- Inventories added $309M.
- Other current assets reduced operating cash flow by $3.044B.
- Other long-term assets reduced operating cash flow by $2.950B.
- Accounts payable added $569M.
- Unearned revenue added $5.438B.
- Other current liabilities added $5.922B.
After the full bridge, Microsoft reported net cash from operations of $136.162B.
|
Cash flow bridge item |
FY2025 amount |
|
Net income |
$101.832B |
|
Depreciation, amortization, and other |
$34.153B |
|
Stock-based compensation |
$11.974B |
|
Accounts receivable movement |
-$10.581B |
|
Total operating cash flow |
$136.162B |
The final number means Microsoft generated about $34.3B more operating cash flow than net income.
For anyone learning how to calculate operating cash flow, this is the moment where the cash statement becomes more useful than the income statement alone.
That difference is mainly explained by large non-cash add-backs, partly offset by working capital investment as receivables expanded with growth.
The lesson is direct.
A strong income statement is more convincing when operating cash flow confirms that profit is converting into cash.

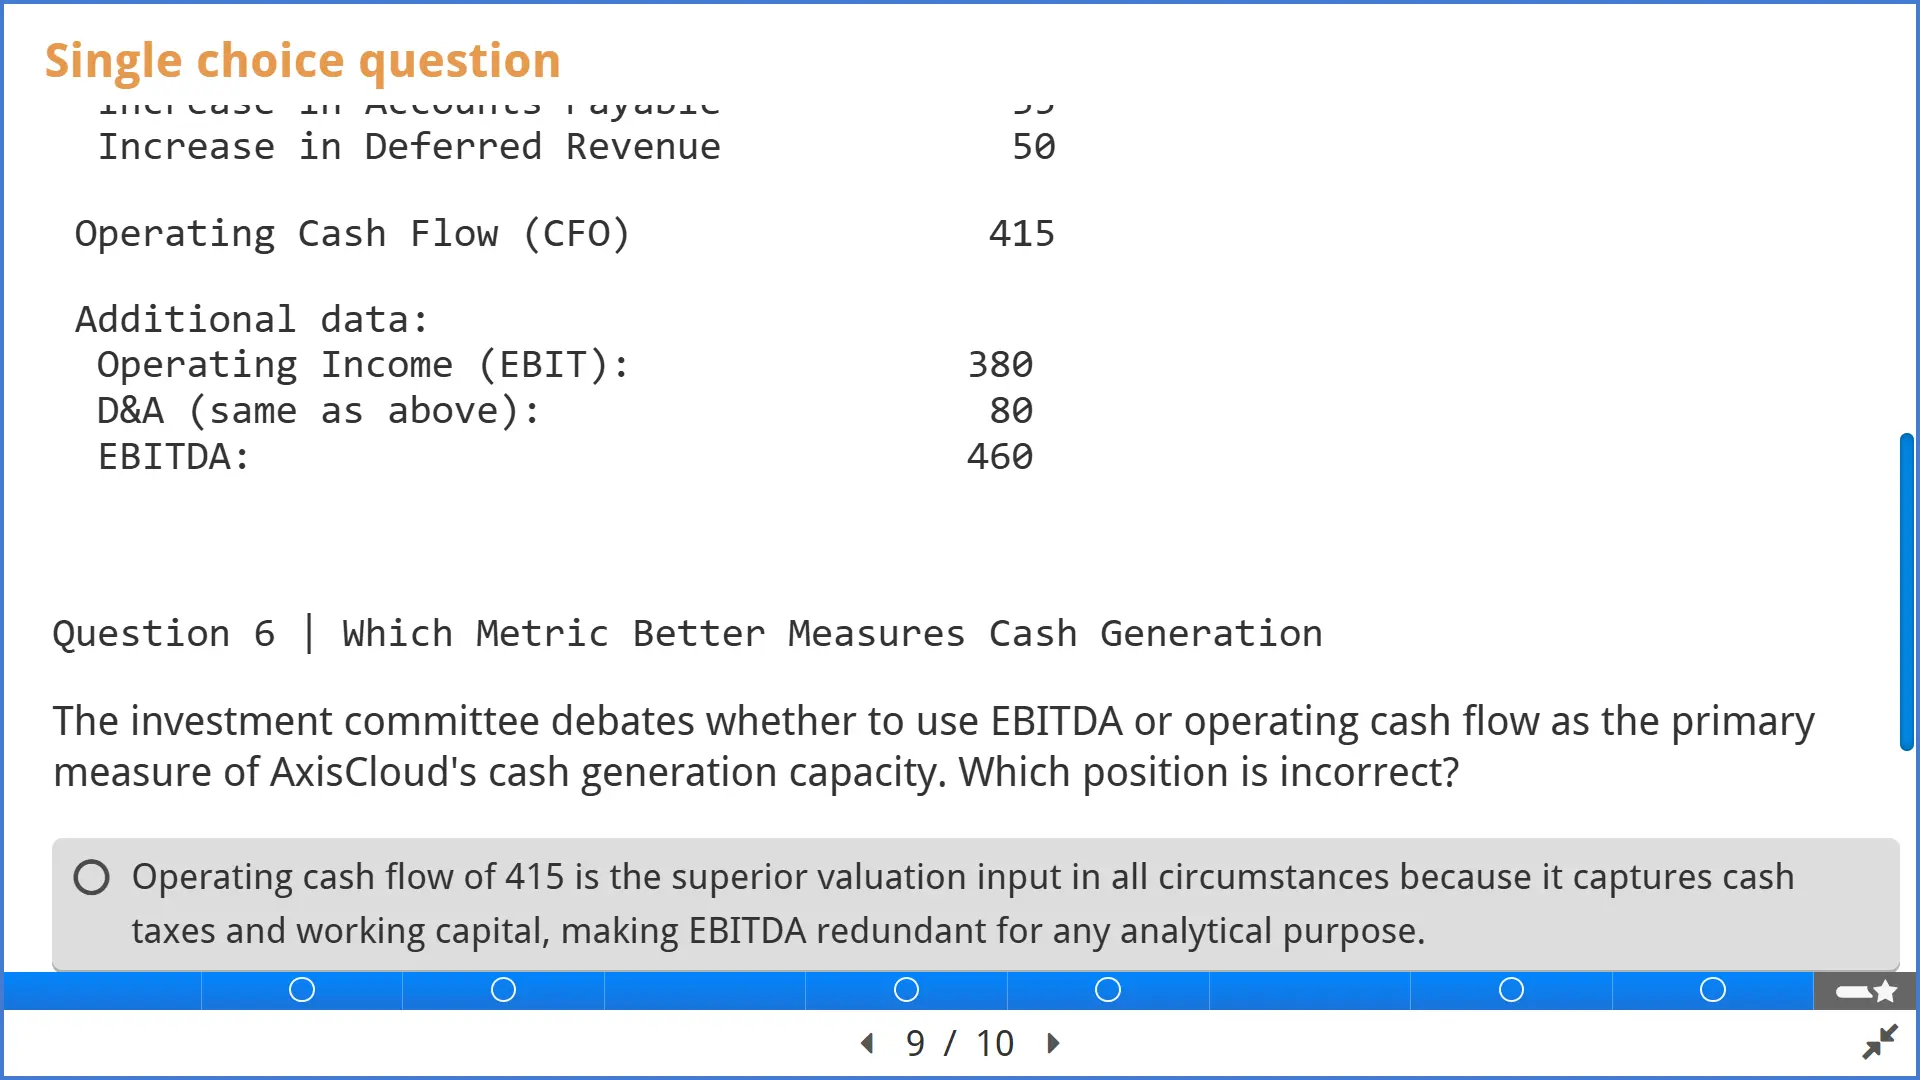
EBITDA vs Operating Cash Flow
EBITDA and operating cash flow are often discussed together, but they are not the same metric.
This distinction is central when analysts learn how to calculate operating cash flow for valuation rather than for a simple accounting exercise.
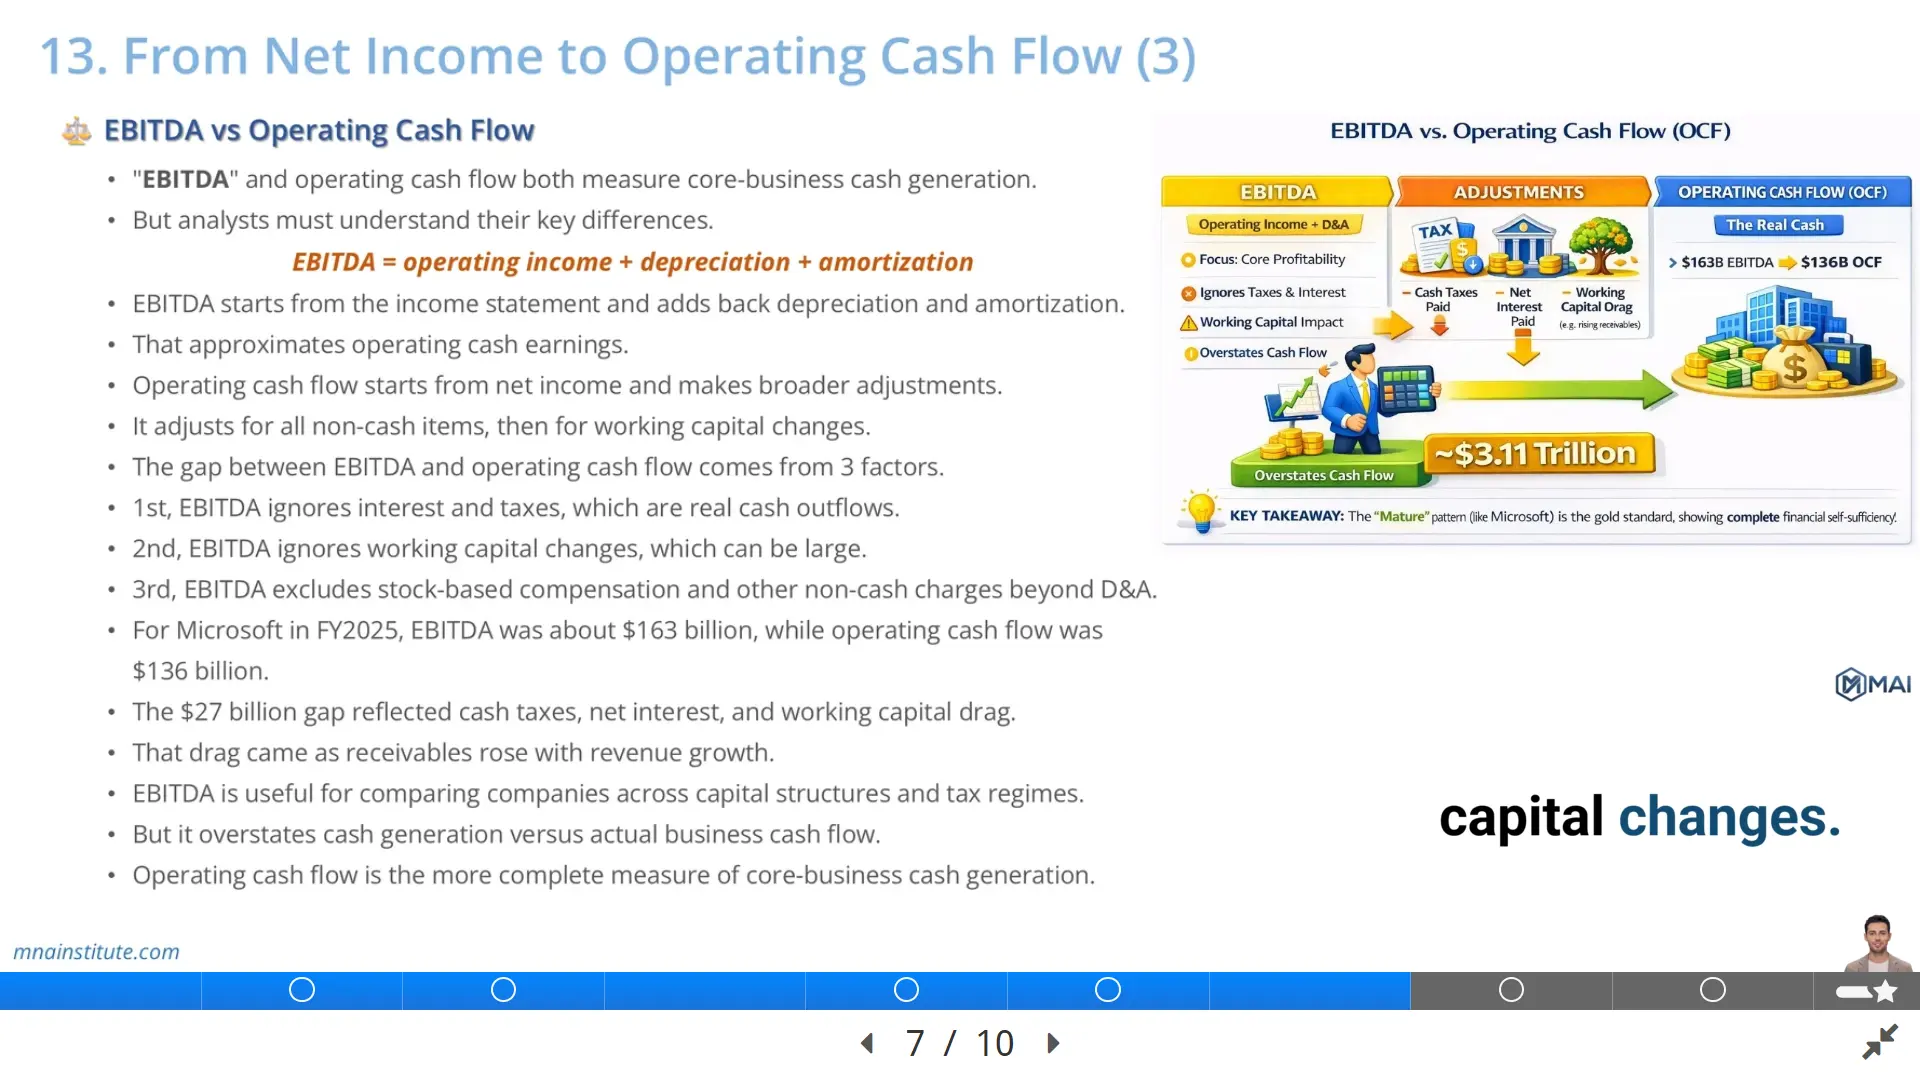
EBITDA starts with operating income and adds back depreciation and amortization.
EBITDA = Operating Income + Depreciation + Amortization
Operating cash flow starts with net income and adjusts for all relevant non-cash items and working capital movements.
This is why EBITDA can be useful for comparing operating profitability across companies, but it is not a complete measure of cash generated by the business.
EBITDA ignores cash taxes, interest, and working capital changes.
Operating cash flow captures those items through the reconciliation from net income.
For Microsoft fiscal year 2025, EBITDA was approximately $163B, using operating income of about $129B plus depreciation and amortization of about $34B.
Operating cash flow was $136.162B.
The gap of roughly $27B shows why EBITDA is not cash flow.
Part of the difference comes from taxes and interest.
Part of the difference comes from working capital movements, especially the increase in receivables.
Part of the difference comes from the fact that EBITDA begins above several real cash obligations.
Analysts use EBITDA because it is a practical profitability proxy in valuation multiples, debt capacity analysis, and peer comparison.
Analysts use operating cash flow because it shows whether the business actually converted earnings into cash during the reporting period.
A company with rising EBITDA but weak operating cash flow deserves closer review.
The answer to how to calculate operating cash flow is therefore more complete than the answer to how to calculate EBITDA.

How Analysts Use Operating Cash Flow to Test Earnings Quality
Operating cash flow is one of the fastest earnings quality checks available to an analyst.
This is why how to calculate operating cash flow belongs inside every serious earnings quality review.
The logic is simple.
High-quality earnings should eventually convert into cash.
Low-quality earnings may remain trapped in receivables, inventory, capitalized costs, or accounting adjustments.
A single year does not prove the full story because working capital timing can move sharply in any period.
A multi-year pattern is more meaningful.
Analysts compare net income to operating cash flow over three to five years to see whether profit is supported by cash generation.
They also compare operating cash flow to EBITDA to see how much cash is lost between adjusted profitability and actual operating cash generation.
A company that consistently reports operating cash flow above net income often has strong cash conversion, assuming the pattern is not driven by temporary supplier stretching or unsustainable deferred revenue growth.
A company that consistently reports net income above operating cash flow may have collection problems, inventory buildup, aggressive revenue recognition, or weak cash discipline.
The Microsoft example is strong because net income was $101.832B while net cash from operations was $136.162B.
The business generated more cash than accounting profit in that year.
However, the analyst still checks the components.
A large add-back for stock-based compensation raises dilution questions.
A large receivables outflow raises collection and billing questions.
A large unearned revenue inflow raises questions about subscription billing and future service obligations.
The conclusion comes from the full bridge, not from one headline number.
Once analysts know how to calculate operating cash flow, they can identify whether the bridge is supported by durable operations or by one-time timing benefits.

How to Calculate Operating Cash Flow in Valuation Models
Knowing how to calculate operating cash flow also helps analysts build better valuation models.
In a model, how to calculate operating cash flow becomes a forecasting discipline, not merely a historical reconciliation.
A weak model often starts with revenue, applies a profit margin, and assumes cash generation follows automatically.
A stronger model separates accounting profit from cash conversion.
The analyst forecasts revenue, operating margin, taxes, non-cash charges, receivables, inventory, payables, deferred revenue, capital expenditure, and financing needs separately.
Operating cash flow becomes the bridge between the income statement and free cash flow.
For valuation, operating cash flow is not the final cash flow available to investors because it still comes before capital expenditure.
Free cash flow usually starts with operating cash flow and subtracts capital expenditure.
Free Cash Flow = Operating Cash Flow – Capital Expenditure
This means a company can have strong operating cash flow but still produce limited free cash flow if it must reinvest heavily in property, equipment, data centers, or inventory.
Microsoft generated very strong operating cash flow in fiscal year 2025, but analysts still need to assess the capital expenditure required to support AI and cloud infrastructure growth.
That is the difference between cash generated by operations and cash available after reinvestment.
The same logic applies in M&A due diligence.
A buyer should not value a target only from net income or EBITDA.
The buyer needs to know whether the target collects receivables on time, manages working capital efficiently, and converts earnings into cash after normal operating needs.
This is why operating cash flow sits close to the center of valuation, credit analysis, equity research, and acquisition screening.
It turns accounting profit into a cash-based view of business quality.
That is the reason how to calculate operating cash flow is one of the first practical cash flow skills a valuation analyst should master.
It connects net income to operating cash flow, then connects operating cash flow to free cash flow and enterprise value.
Related Courses
- Financial Modeling and Valuation Course with AI and Excel connects operating cash flow, EBITDA, free cash flow, and valuation into one practical modeling workflow.
- Financial Statement Analysis Course with AI for Equity Research focuses on reading income statements, balance sheets, and cash flow statements as one integrated business story.
- 3-Statement Financial Modeling Course with AI is useful when the goal is to link net income, working capital, operating cash flow, and free cash flow inside an Excel model.
- For transaction work, the Mergers and Acquisitions Online Course and M&A Due Diligence Course show why cash conversion, working capital, and earnings quality matter when assessing a target company.
Sources
- Microsoft FY25 Q4 Cash Flows
- Microsoft 2025 Annual Report
- SEC Beginner’s Guide to Financial Statements
- CFA Institute Free Cash Flow Valuation