Financial Ratio Analysis Excel: Cash Conversion Cycle, DuPont and Valuation Multiples
An analyst does not create value by copying numbers from an annual report into Excel.
The value starts when those numbers are organized so that every ratio, margin, turnover measure, return metric, and valuation multiple updates from one clean source data layer.
That is the practical purpose of a financial ratio analysis Excel model.
It converts raw filings into a structured decision tool, where the user can move from reported statements to business interpretation without rebuilding formulas every time.
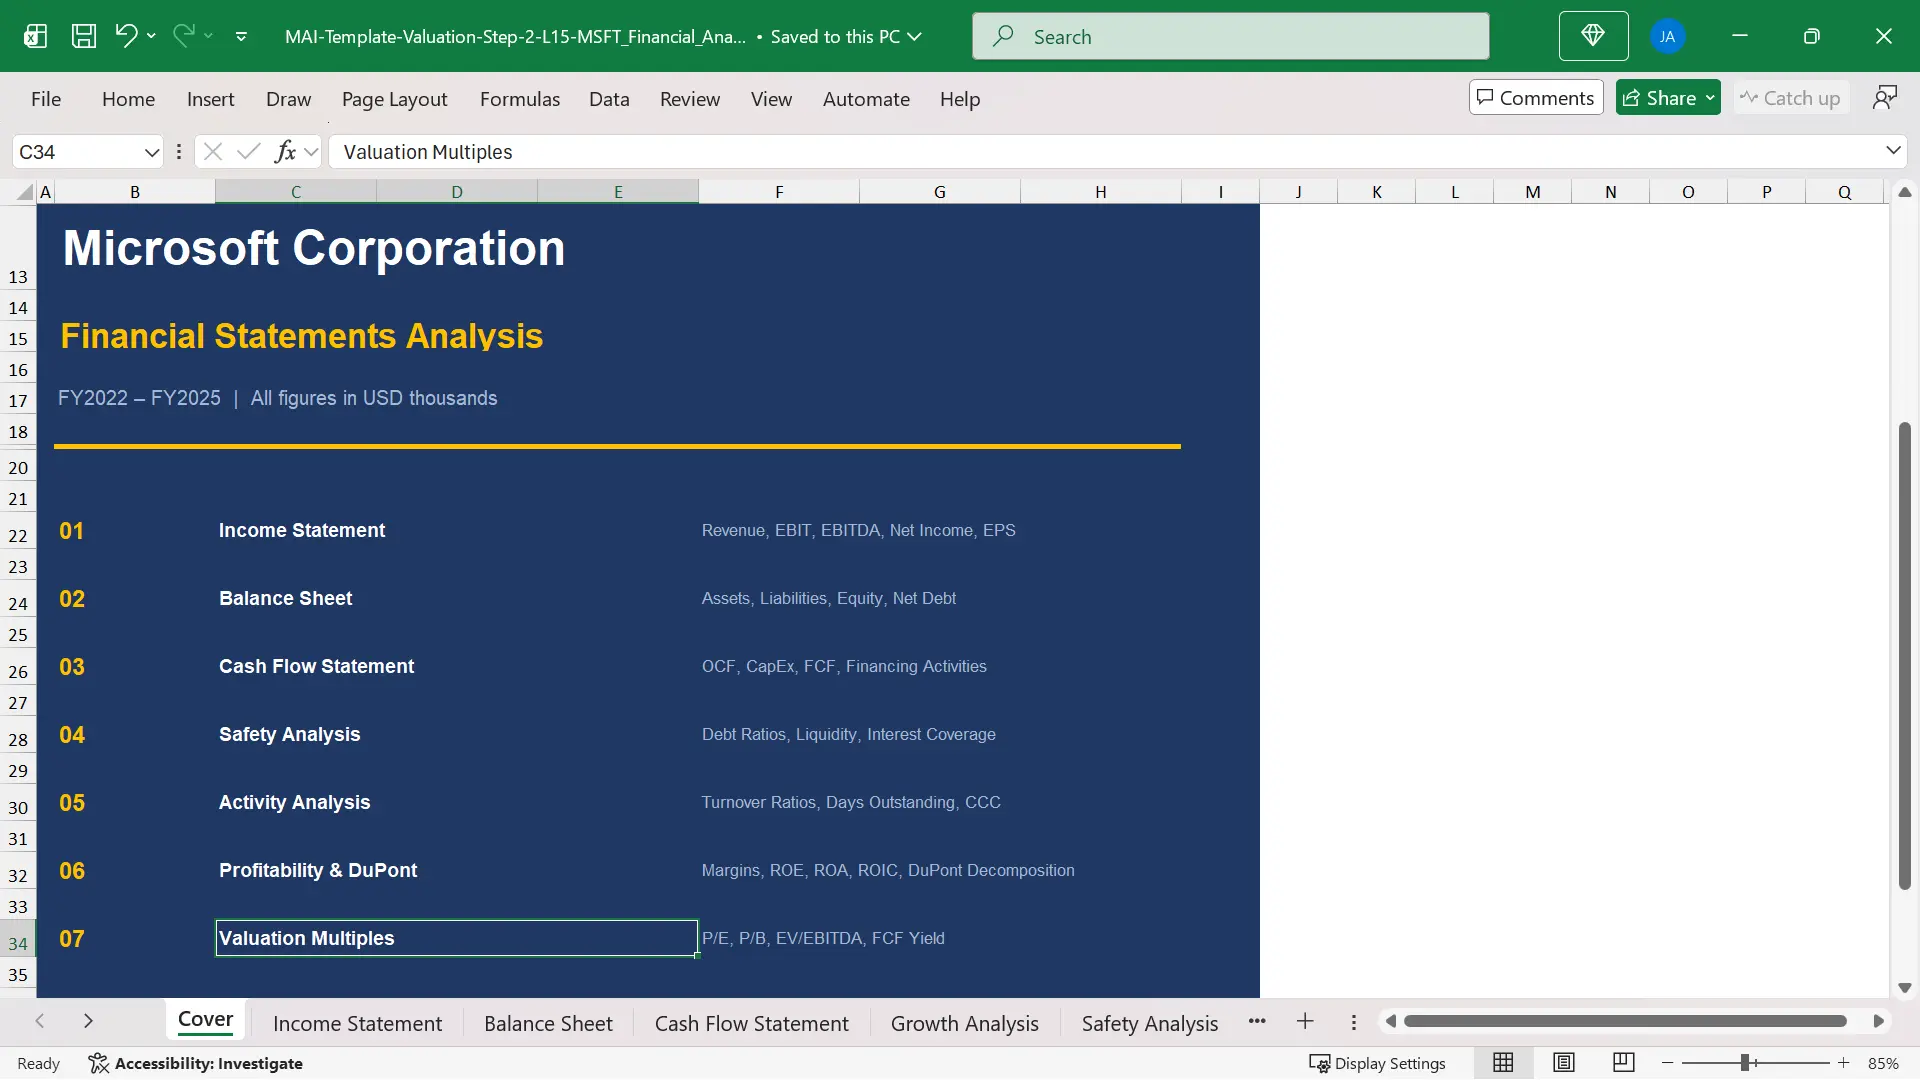
The model discussed here uses Microsoft FY2022 to FY2025 financial data and organizes the analysis into nine tabs.
The structure is simple enough for a student to understand, but disciplined enough to reflect how professional analysts build a repeatable financial ratio analysis template.
The point is not to make Excel look complex.
The point is to make the logic traceable.
Blue cells contain hardcoded source inputs from filings or market data.
Black cells contain formulas that calculate automatically once the source data is complete.
That separation prevents one of the most common beginner mistakes: mixing copied numbers, formulas, and judgment cells in the same analytical area.
That is why financial ratio analysis Excel should be built as a workflow, not as a decorative output table.
A clean financial ratio analysis Excel workflow should answer three questions.
First, where did the data come from.
Second, which ratios are calculated from that data.
Third, what does each ratio reveal about growth, safety, efficiency, profitability, capital discipline, and market valuation.
The model map is summarized below.
|
Tab |
Role |
Main Output |
|
Sheet 1: Cover |
Navigation |
Company, period, unit, model map |
|
Sheet 2: Income Statement |
Source data |
Revenue, EBIT, EBITDA, net income |
|
Sheet 3: Balance Sheet |
Source data |
Assets, liabilities, equity, net debt |
|
Sheet 4: Cash Flow Statement |
Source data |
OCF, CapEx, FCF, financing cash flow |
|
Sheet 5: Growth Analysis |
Analysis |
Revenue, EBIT, EBITDA, net income, FCF growth |
|
Sheet 6: Safety Analysis |
Analysis |
Leverage, liquidity, interest coverage |
|
Sheet 7: Activity Analysis |
Analysis |
Turnover ratios, DSO, DIO, DPO, CCC |
|
Sheet 8: Profitability and DuPont |
Analysis |
Margins, ROE, ROA, ROIC, DuPont |
|
Sheet 9: Valuation Multiples |
Analysis |
P/E, P/B, EV multiples, FCF yield |

Why Financial Ratio Analysis Excel Starts with Source Data
A financial ratio analysis Excel model should start with source data, not with ratios.
This may sound basic, but it changes the entire quality of the analysis.
If a model begins with manually typed ratios, the user cannot easily check whether the calculation is correct.
If the model begins with the income statement, balance sheet, and cash flow statement, every ratio can be traced back to a specific reported line item.
The Microsoft model uses three source data sheets: Income Statement, Balance Sheet, and Cash Flow Statement.
These sheets contain four fiscal years of data, from FY2022 to FY2025, with each fiscal year ending June 30.
All figures are entered in USD thousands so the scale stays consistent across revenue, assets, cash flow, market capitalization, and enterprise value.
The income statement begins with revenue and moves down to net income, with EBIT and EBITDA added as calculated lines.
The balance sheet captures assets, liabilities, equity, and net debt.
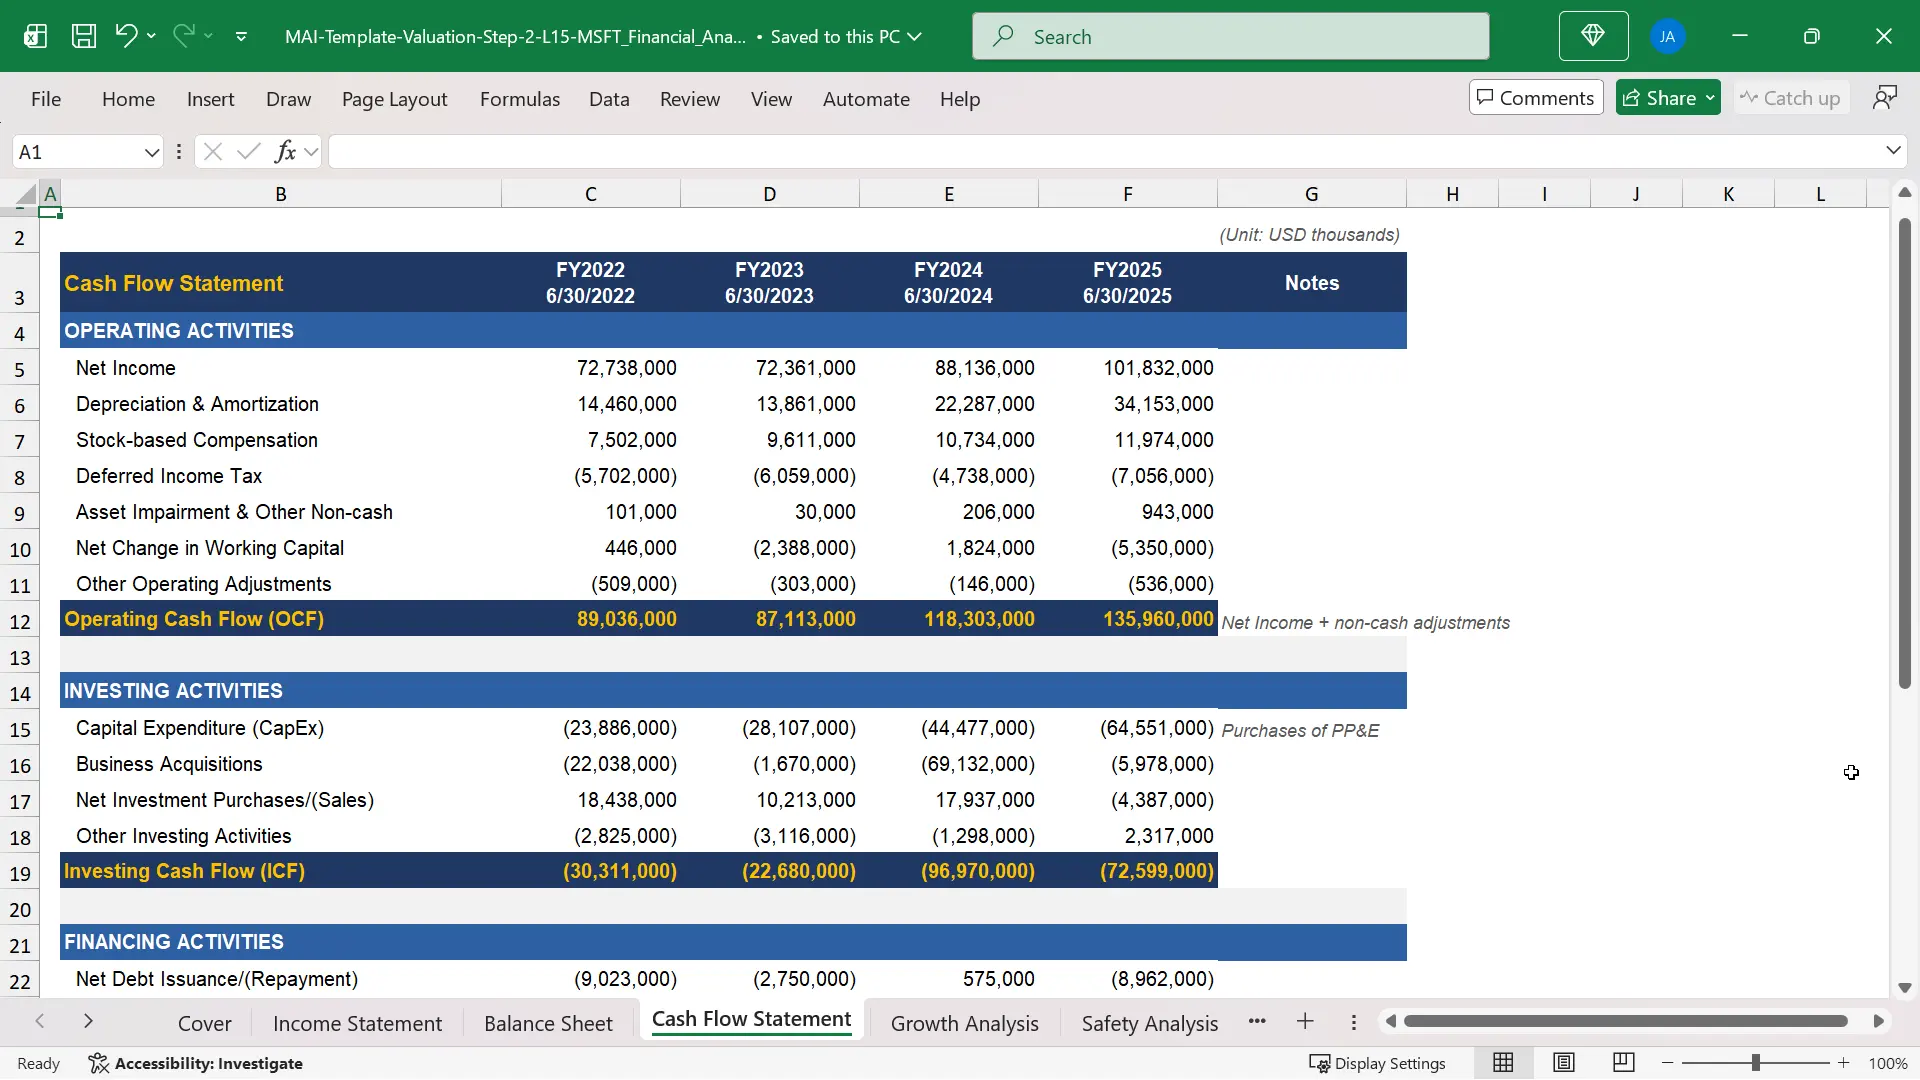
The cash flow statement captures operating cash flow, capital expenditure, free cash flow, investing activity, and financing activity.
The source data approach also makes error review faster.
If Microsoft revenue changes, only one blue input cell should change.
Every downstream growth rate, margin, turnover ratio, valuation multiple, and return metric should update automatically.
That is why the source data layer is the foundation of a professional financial ratio analysis template.
The analyst can then focus on interpretation rather than manually repairing formulas across the workbook.
In financial ratio analysis Excel, traceability is the difference between a spreadsheet that looks useful and a model that can survive review.

The 9-Tab Structure of the Financial Ratio Analysis Excel Model
The workbook is organized into nine tabs, each serving a specific analytical purpose.
A 9-tab structure is enough to separate the workflow without making the model unnecessarily heavy.
The first tab is the Cover sheet, which gives the model title, company name, fiscal period, units, and the map of workbook sections.
The next three tabs are source sheets: Income Statement, Balance Sheet, and Cash Flow Statement.
The final five tabs are analysis sheets: Growth Analysis, Safety Analysis, Activity Analysis, Profitability and DuPont, and Valuation Multiples.
This structure forces the analyst to respect the difference between source data and analysis.
The analysis tabs should not contain manually entered operating numbers.
They should pull from the source tabs through cell links.
For example, Microsoft FY2025 revenue of $281.724B appears once in the Income Statement sheet.
The Growth Analysis sheet then uses that revenue figure to calculate growth.
The Profitability and DuPont sheet uses it to calculate margins and asset turnover.
The Valuation Multiples sheet uses it to calculate EV/Revenue.
This is the basic logic behind how to calculate financial ratios in Excel in a scalable way.
One hardcoded number feeds many analytical outputs.
One source error can be found and fixed in one place.
A good financial ratio analysis Excel layout keeps source tabs separate from analysis tabs so the workflow can be repeated for another company.
How the Three Statement Sheets Feed the Model
The three statement sheets are not just copied financial statements.
They are the data engine of the financial ratio analysis Excel model.
The income statement in the model builds from revenue to net income and adds EBIT and EBITDA as intermediate lines.
Microsoft does not report EBITDA directly, so the model calculates it from operating income and depreciation and amortization.
EBITDA = Operating Income + Depreciation and Amortization
For Microsoft FY2025, operating income was $128.528B and depreciation and amortization was $34.153B.
That produces EBITDA of approximately $162.681B.
This calculated line later supports EBITDA margin and EV/EBITDA in the analysis tabs.
The cash flow statement also adds a calculated free cash flow row at the bottom.
FCF = Operating Cash Flow + Capital Expenditure
The formula adds capital expenditure because CapEx appears as a negative investing cash flow in the source data.
Microsoft FY2025 operating cash flow was $135.960B and CapEx was negative $64.551B.
The model therefore calculates free cash flow of about $71.409B.
The balance sheet supplies the average balance sheet figures needed for ratios that combine a period number with a point-in-time number.
A turnover ratio should usually use average assets, average receivables, average inventory, or average equity.
This matters because the income statement covers a full year while the balance sheet captures a single date.
The model handles that timing difference through average balance formulas in the analysis tabs.
In financial ratio analysis Excel, the formula path from filing line item to final ratio should be visible to any reviewer.

Growth and Safety Analysis in the Excel Ratio Model
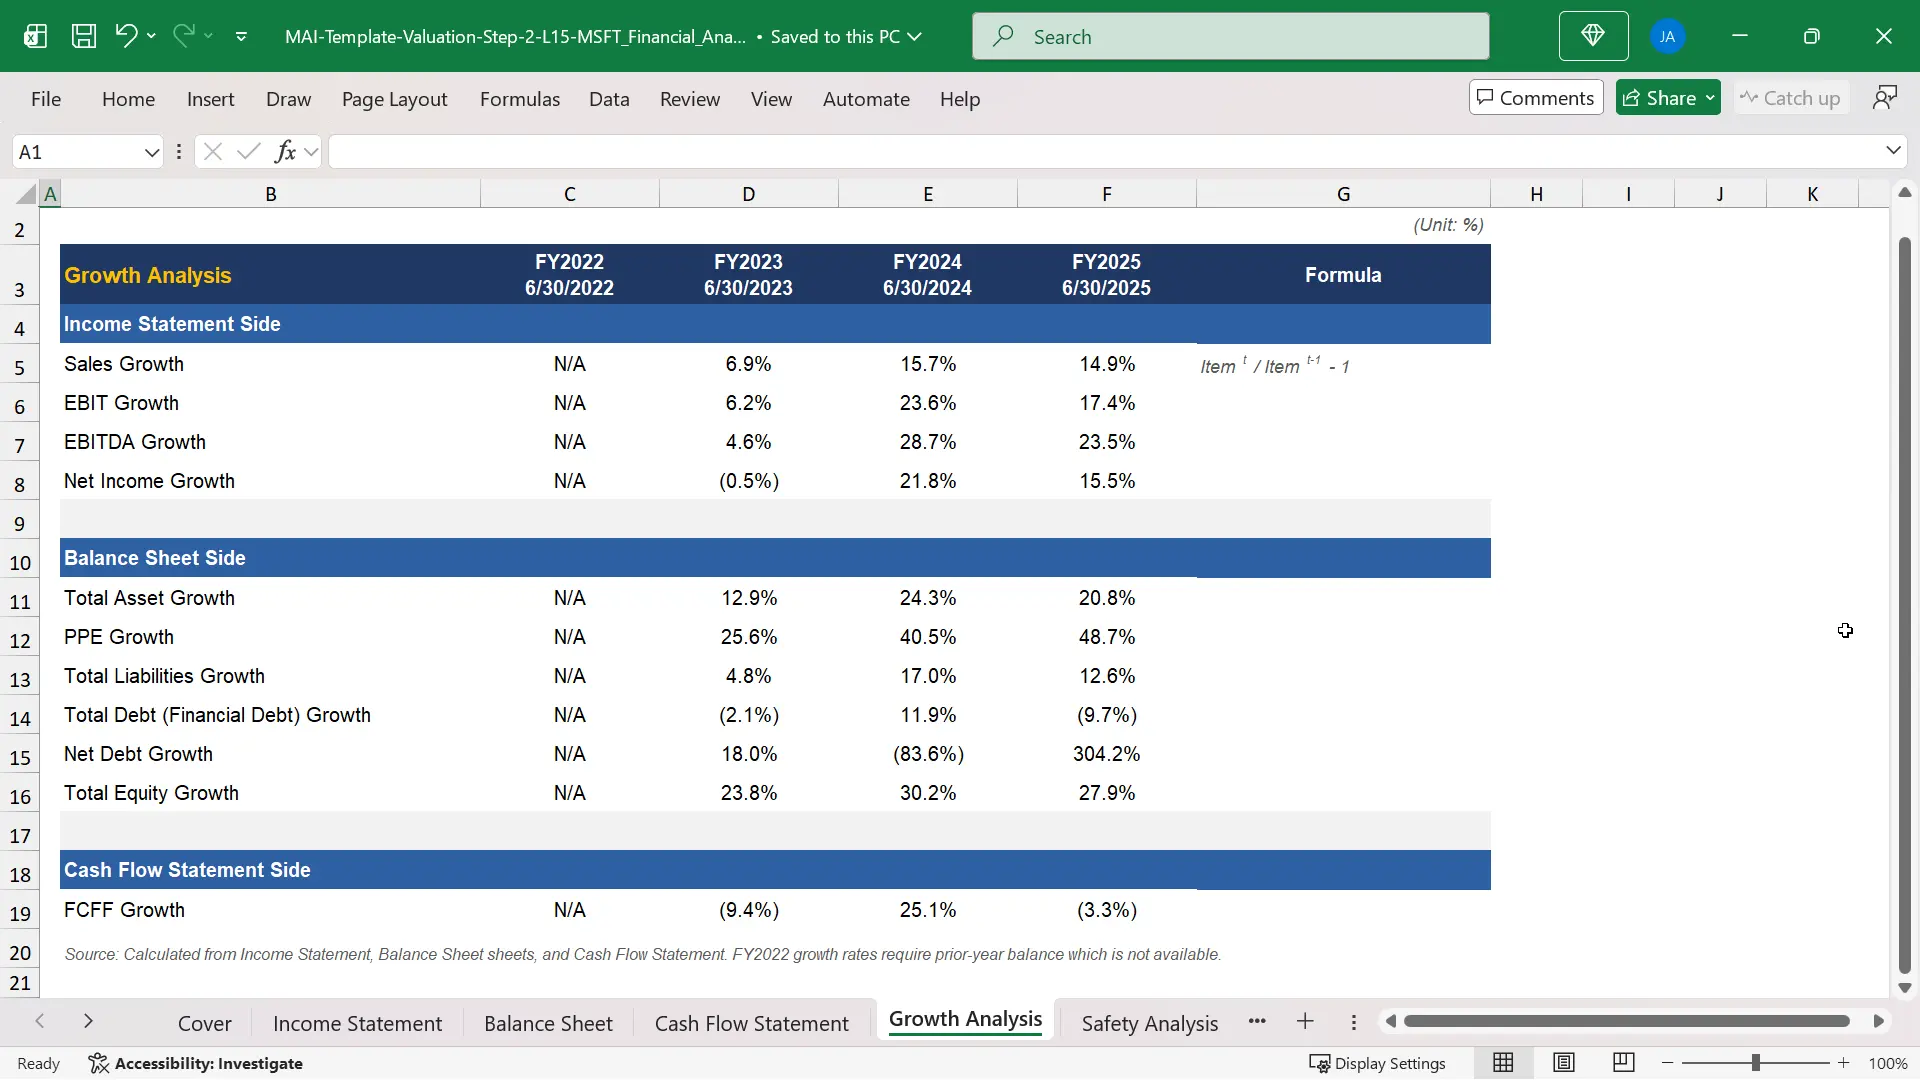
The Growth Analysis tab answers a straightforward question: which key financial lines are expanding, shrinking, or becoming more volatile.
The model calculates year-over-year growth rates for revenue, EBIT, EBITDA, net income, total assets, equity, and free cash flow.
The formula is consistent across the tab.
Growth Rate = Current Year / Prior Year – 1
Consistency matters because a user should not need to inspect a different formula every time the row changes.
Revenue growth helps the analyst evaluate demand and market expansion.
EBIT and EBITDA growth reveal whether profit is scaling faster or slower than sales.
Free cash flow growth shows whether accounting performance is converting into cash after capital expenditure.
The Safety Analysis tab then shifts the question from growth to balance sheet risk.
It covers leverage ratios, liquidity ratios, and interest coverage.
Microsoft FY2025 interest coverage was approximately 54x, meaning EBIT was about 54 times larger than interest expense.
The model also shows negative net debt across the period, meaning Microsoft held more cash and short-term investments than financial debt.
That detail changes how the analyst interprets enterprise value and solvency risk.
A highly leveraged company and a net cash company can have similar earnings, but they do not carry the same financial risk.
A good financial ratio analysis template should therefore separate growth quality from financial safety.
This financial ratio analysis Excel format prevents a growing company from being judged only by sales momentum while ignoring liquidity and solvency.

Activity Analysis and the Cash Conversion Cycle
The Activity Analysis tab is where the model moves from accounting size to operating efficiency.
It calculates turnover ratios and days metrics for receivables, inventory, payables, working capital, fixed assets, total assets, and equity.
These ratios show how much revenue the business generates from the assets and operating balances it must carry.
The most useful output in this tab is often the cash conversion cycle.
CCC = DSO + DIO – DPO
- DSO measures how many days it takes to collect receivables from customers.
- DIO measures how many days inventory stays on the balance sheet before it is sold.
- DPO measures how many days the company takes to pay suppliers.
Microsoft had a negative cash conversion cycle in all three calculated years in the workbook.
In FY2025, the cash conversion cycle reached approximately minus 17 days.
That means Microsoft collected cash from customers before it paid suppliers on average.
This is structurally favorable for operating cash flow because growth does not require as much incremental working capital as a business with a positive cash cycle.
The cash conversion cycle is also a useful warning system.
- If DSO rises sharply while revenue grows, the analyst should ask whether customers are taking longer to pay.
- If DIO rises sharply, the analyst should ask whether inventory is building faster than sales.
- If DPO rises sharply, the analyst should ask whether cash flow is being helped by delayed supplier payments.
This is where financial ratio analysis Excel becomes more than a mechanical spreadsheet exercise.
The model gives the analyst a signal, but the analyst must interpret the business reason behind the signal.
For activity analysis, financial ratio analysis Excel should connect days metrics to working capital behavior rather than leave them as isolated ratios.

Profitability, ROE and the DuPont Analysis Formula
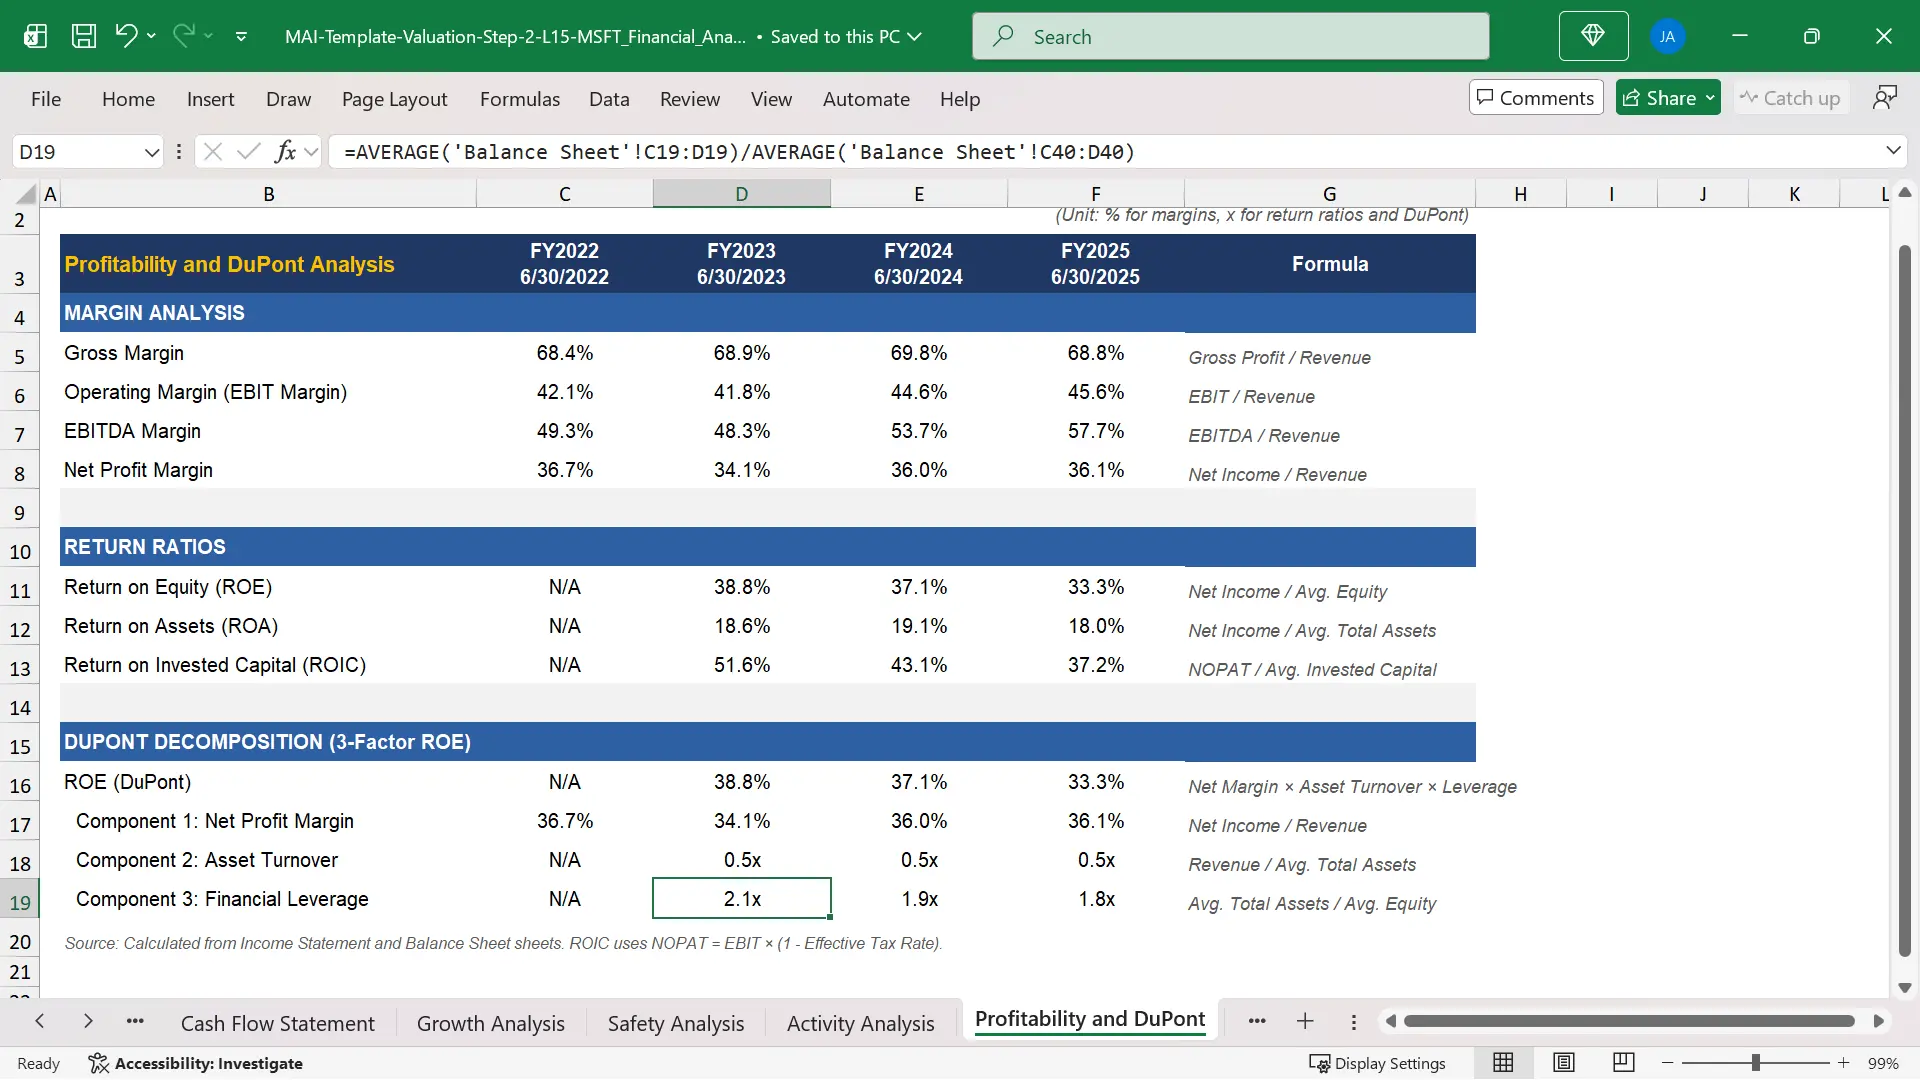
The Profitability and DuPont tab connects margins, returns, and capital efficiency.
It calculates gross margin, operating margin, EBITDA margin, net margin, ROE, ROA, and ROIC.
Margins show how much profit the company keeps at each level of the income statement.
Return ratios show how much income the company generates from the capital and assets deployed in the business.
The DuPont analysis formula then explains why ROE is high or low.
ROE = Net Margin x Asset Turnover x Financial Leverage
This formula separates ROE into three drivers.
Net margin measures profitability per dollar of sales.
Asset turnover measures revenue generated per dollar of assets.
Financial leverage measures how much asset base is supported by each dollar of equity.
Microsoft FY2025 ROE was approximately 33.3%.
The model shows that this ROE was driven mainly by a net margin of about 36.1%, not by aggressive leverage or unusually high asset turnover.
That interpretation matters because the same ROE can come from very different economic structures.
A bank can produce high ROE through leverage.
A software company can produce high ROE through high margins and asset-light economics.
A retailer can produce acceptable ROE through low margins but high asset turnover.
The DuPont analysis formula prevents the analyst from treating ROE as a single unexplained output.
It forces the model user to identify the real driver of shareholder return.
In financial ratio analysis Excel, DuPont is useful because it turns ROE from a headline metric into a diagnostic bridge.

Valuation Multiples from the Same Financial Ratio Analysis Excel Workbook
The Valuation Multiples tab connects accounting performance to market pricing.
This tab uses the June 30, 2025 share price of $446.41 and diluted shares outstanding to calculate market capitalization.
The model then calculates enterprise value using net debt.
EV = Market Capitalization + Net Debt
Because Microsoft was in a net cash position, its enterprise value of approximately $3.30T was slightly lower than its market capitalization of approximately $3.33T.
The valuation tab calculates P/E, P/B, EV/Revenue, EV/EBITDA, EV/EBIT, free cash flow per share, and FCF yield.
These outputs help the analyst understand how the market is pricing Microsoft relative to earnings, book value, sales, operating profit, EBITDA, and free cash flow.
For FY2025, the model calculates EV/Revenue at approximately 11.7x and EV/EBITDA at approximately 20.3x.
It also calculates an FCF yield of approximately 2.1% using free cash flow per share divided by the share price.
The benefit of linking valuation multiples to the source statements is control.
If EBITDA is recalculated, EV/EBITDA updates.
If free cash flow changes, FCF yield updates.
If share count or share price changes, market capitalization and enterprise value update.
That is the reason a financial ratio analysis Excel model should not be a collection of isolated calculations.
It should be a connected system where each valuation output is traceable to a source input.
The valuation module completes the financial ratio analysis Excel flow by linking statement performance to market expectations.

How to Replicate the Financial Ratio Analysis Excel Model for Any Company
The same financial ratio analysis Excel structure can be replicated for almost any listed company.
The process begins by replacing the blue hardcoded inputs with figures from the target company annual report or Form 10-K.
Start with the oldest fiscal year and move to the most recent fiscal year.
That sequence makes year-over-year formulas easier to audit.
Then complete the income statement, balance sheet, and cash flow statement before touching the analysis tabs.
Once the source sheets are complete, the analysis sheets should update automatically.
That is how to calculate financial ratios in Excel without manually rebuilding each row for every new company.
For companies reporting outside the United States, keep the unit and currency consistent across all sheets.
A company reporting in euros, pounds, won, or yen can use the same structure as long as all source data uses one unit convention.
For companies reporting under IFRS rather than U.S. GAAP, line item labels may differ, but the analytical logic remains similar.
The main adjustment to watch is EBITDA under IFRS 16.
Lease depreciation and lease interest can affect the D&A figure added back to operating income.
A careful analyst documents the definition used rather than assuming every reported D&A number is directly comparable.
A practical replication workflow has five steps.
- Step 1 is to download the annual report or 10-K and create the three source sheets.
- Step 2 is to mark hardcoded inputs in blue and formulas in black.
- Step 3 is to build growth, safety, activity, profitability, DuPont, and valuation tabs from links.
- Step 4 is to run reasonableness checks on key ratios such as margins, interest coverage, cash conversion cycle, ROE, ROIC, and EV/EBITDA.
- Step 5 is to write a short interpretation of what the ratios actually reveal about the business.
That final step is where the model becomes analysis.
Without interpretation, even a clean financial ratio analysis template is only a workbook.
With interpretation, it becomes an analyst tool for equity research, valuation, M&A screening, and credit review.
This is how to calculate financial ratios in Excel as an integrated analysis process rather than as separate worksheet arithmetic.
Related Courses
- This topic connects most directly to Financial Statement Analysis Course with AI for Equity Research and Financial Modeling and Valuation Course with AI and Excel, because both require clean source data, linked formulas, and disciplined interpretation of business performance.
- The Financial Statement Analysis Course with AI for Equity Research is directly aligned with the logic of reading statements, calculating ratios, and interpreting what those ratios reveal about business quality.
- The 3-Statement Financial Modeling Course with AI is useful when the learner wants to go beyond historical ratio analysis and build a forward-looking model from the three statements.
- For M&A readers, ratio analysis also supports screening, due diligence, buyer analysis, synergy assessment, and valuation benchmarking through the analytical workflow taught across the Mergers and Acquisitions Online Course and the M&A Due Diligence Course.
Sources
- Microsoft 2025 Annual Report
- Microsoft FY2025 Form 10-K on SEC EDGAR
- SEC Investor Bulletin: How to Read a 10-K
- CFA Institute Financial Analysis Techniques