3 Statement Model: Full Financial Modeling in Excel
Most people think a 3 statement model is an Excel exercise, but the real work starts before the first formula.
A serious analyst does not open a spreadsheet and guess a revenue growth rate.
The analyst first studies how the company makes money, what drives price and volume, how customers behave, how costs scale, and how investment needs move with growth.
Only then can the model become a disciplined forecast rather than a mechanical spreadsheet.
This is why the 3 statement model sits at the center of equity research, corporate finance, M&A analysis, and investment valuation.
The model links the income statement, balance sheet, and cash flow statement so that revenue assumptions flow into EPS, EBITDA, FCF, leverage, cash, and valuation-ready outputs.
In that sense, a three statement financial model is not only a technical file.
It is the financial expression of a business thesis.

A Cold Comparison: Generic Modeling Content vs Analyst-Ready Modeling
A useful way to evaluate any financial modeling in Excel training is to compare what it teaches against what analysts actually do at work.
Many resources teach formulas and formatting, but the stronger question is whether the learner can defend the assumptions that created those formulas.
|
Dimension |
Generic Modeling Content |
M&A Institute Workflow |
|
Starting point |
Spreadsheet structure and formula mechanics |
Business research, 10-K signals, and forecast thesis before Excel |
|
Revenue forecast |
Often a simple growth percentage |
Segment, product, customer, price, volume, and industry-driver logic |
|
Schedules |
Taught as separate technical tabs |
Built as links between assumptions, statements, EPS, EBITDA, and FCF |
|
Verification |
Usually limited to balance sheet balance check |
Balance sheet, cash, net income, CapEx, D&A, SBC, guidance, and consensus checks |
|
AI use |
Often positioned as automated output generation |
Used for extraction, organization, verification, and commentary, while judgment stays with the analyst |
|
Final output |
A model that calculates |
A model that supports investment, valuation, M&A, and IC judgment |

Why a 3 Statement Model Starts Before Excel
The difference between a weak model and a strong model is not usually the color of the tabs.
The difference is whether every output can be traced back to a business driver.
If revenue growth is entered as a flat percentage without understanding product mix, pricing, volume, capacity, or customer demand, the model may calculate correctly but still be analytically weak.
The same problem appears in CapEx, working capital, debt, share count, and margin forecasts.
A clean model structure cannot compensate for assumptions that were never connected to the business.
That is why the best learning path for a 3 statement model begins with company analysis.
The analyst needs to know what the company sells, which segments matter, which products are growing, which costs are fixed or variable, and which balance sheet lines move as revenue expands.
Only then does the spreadsheet become a decision tool rather than a mechanical template.
The SEC explains that a Form 10-K gives investors a comprehensive overview of a public company’s business and financial condition, including audited financial statements.
That filing is not just a source of historical numbers.
It is the starting point for understanding how the business should be modeled.
Step 1: Turn Company Research into a Revenue Forecasting Model
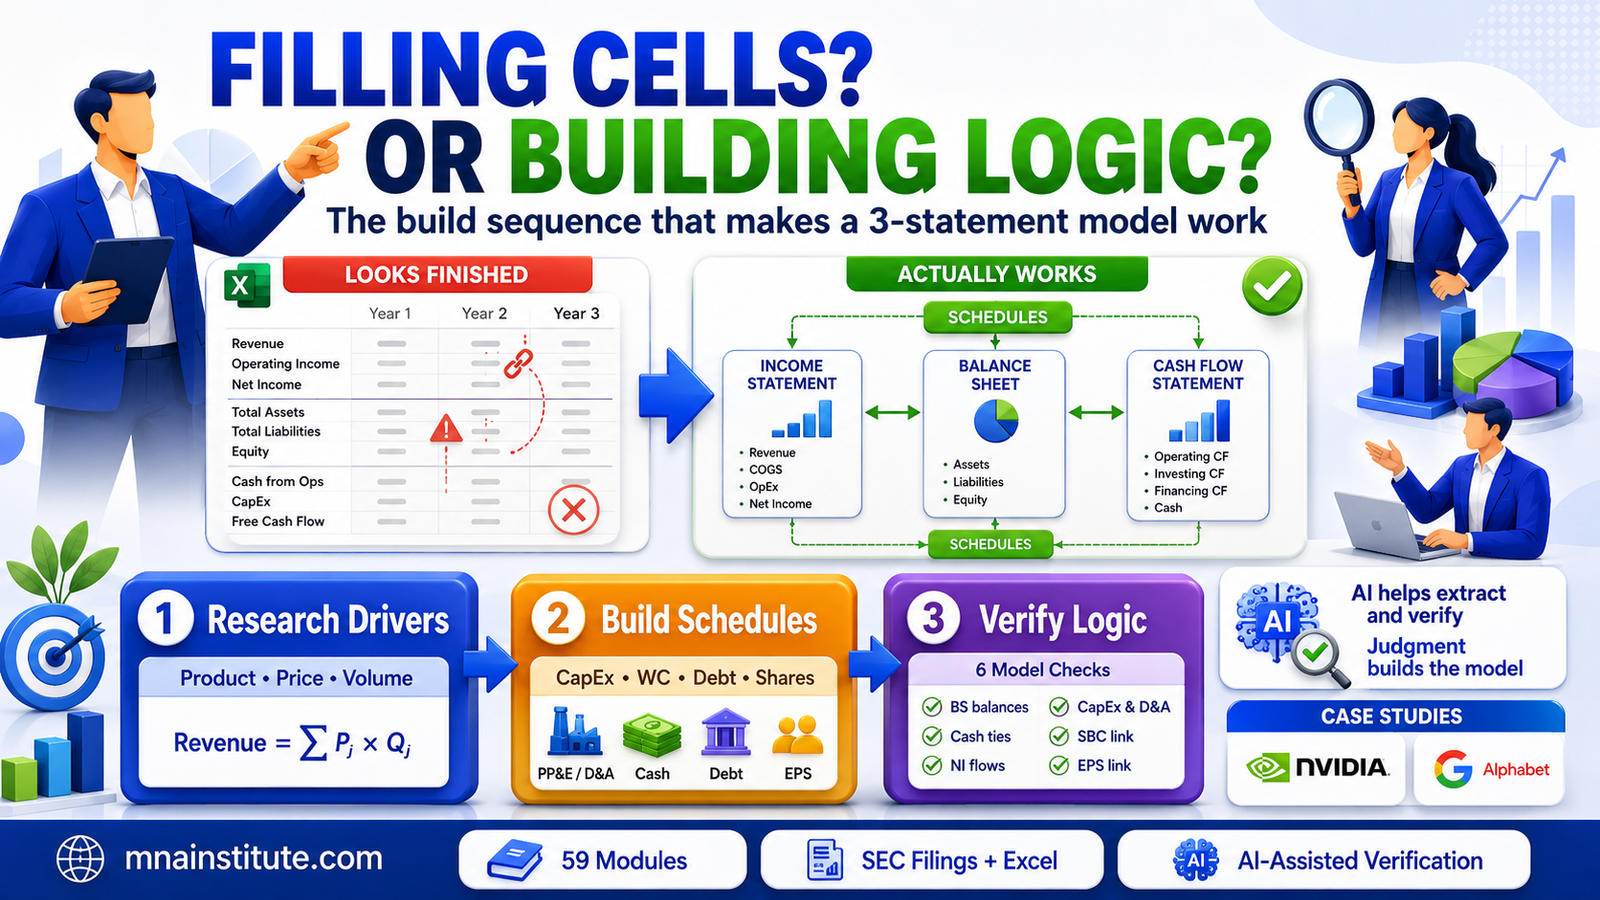
The first practical step in a 3 statement model is converting business research into forecast logic.
This is where many beginner models fail.
They begin with historical revenue and apply a growth rate, but they never explain why that growth rate should happen.
A better model builds a revenue forecasting model from specific drivers.
For a software company, the drivers might include customers, average contract value, retention, expansion revenue, and pricing.
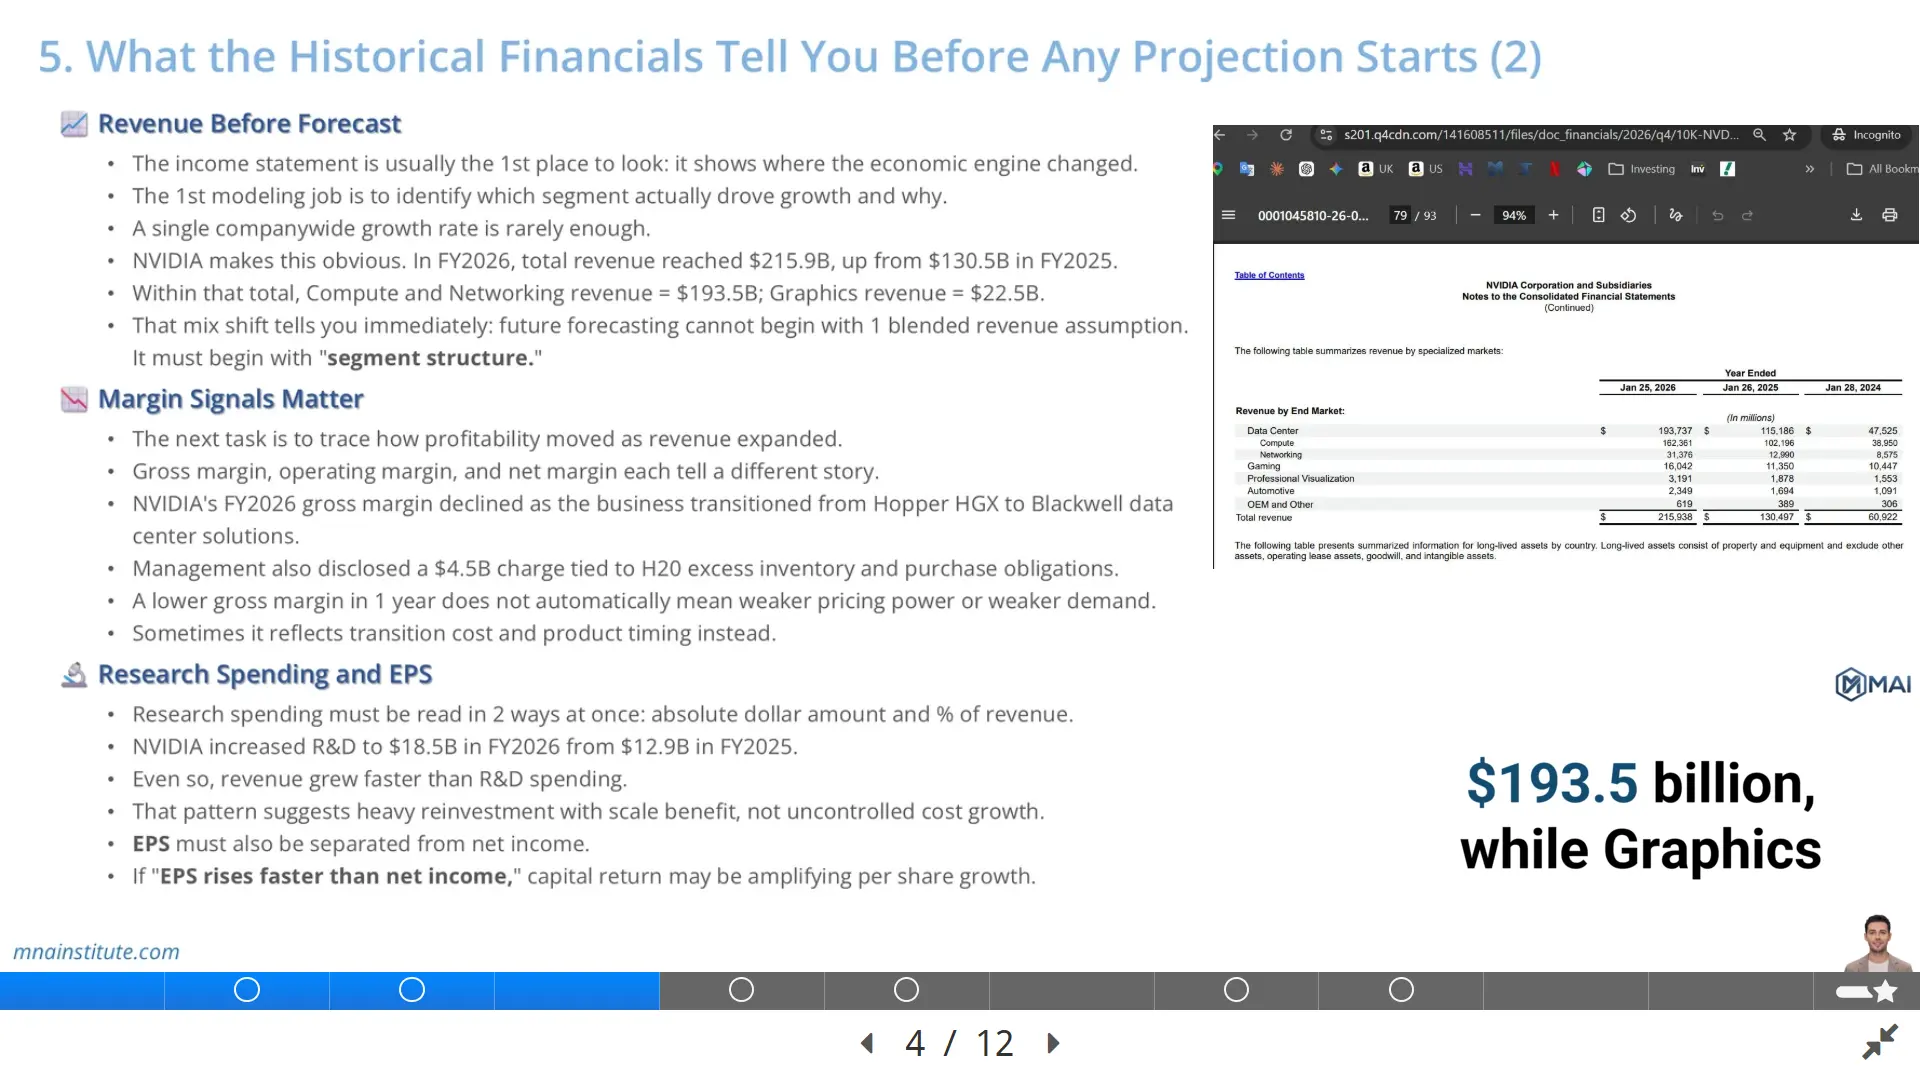
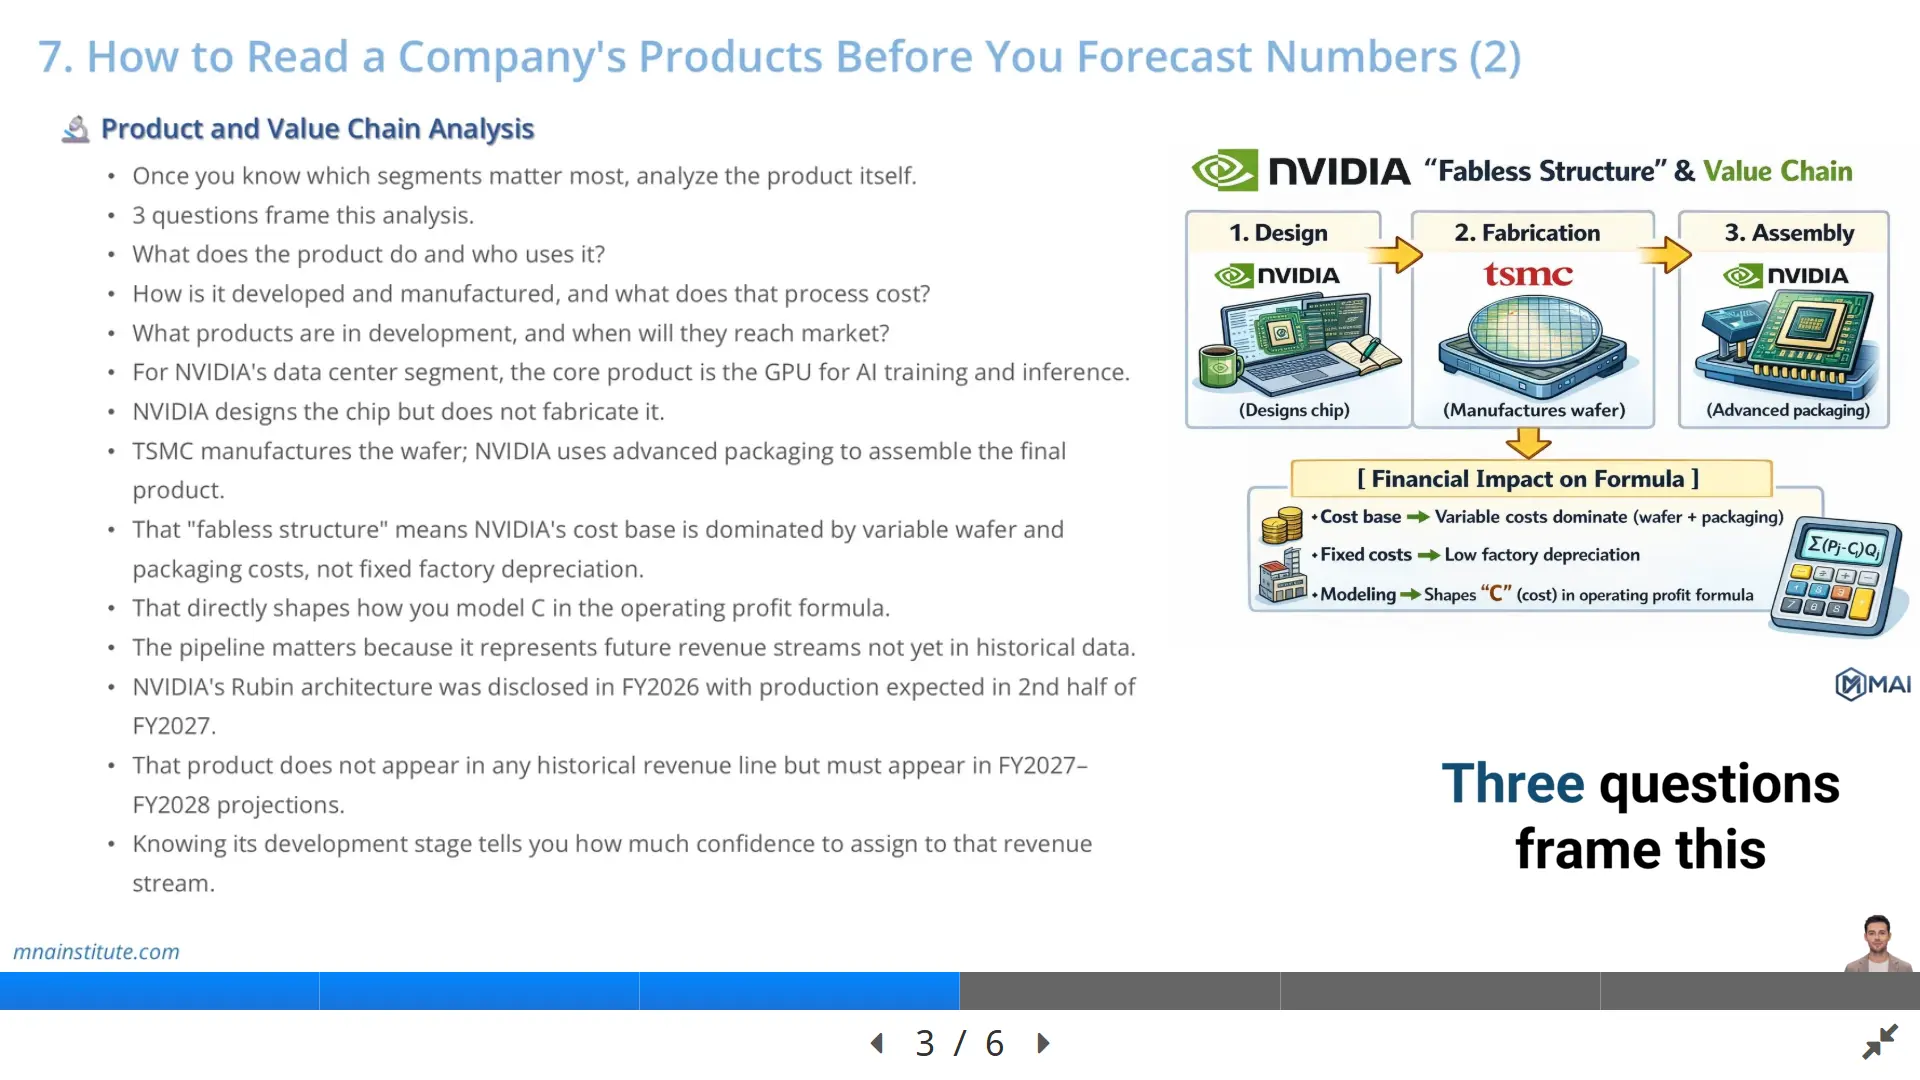
For a semiconductor company, the drivers might include unit shipments, average selling price, product mix, foundry capacity, supply constraints, and demand from data center customers.
For a consumer business, the drivers might include store count, same-store sales, traffic, basket size, and promotional intensity.
The point is not that every industry has the same formula.
The point is that every forecast needs a causal structure.
Revenue should be the result of product, customer, price, volume, and market logic.
When the model begins that way, later schedules become easier to defend.
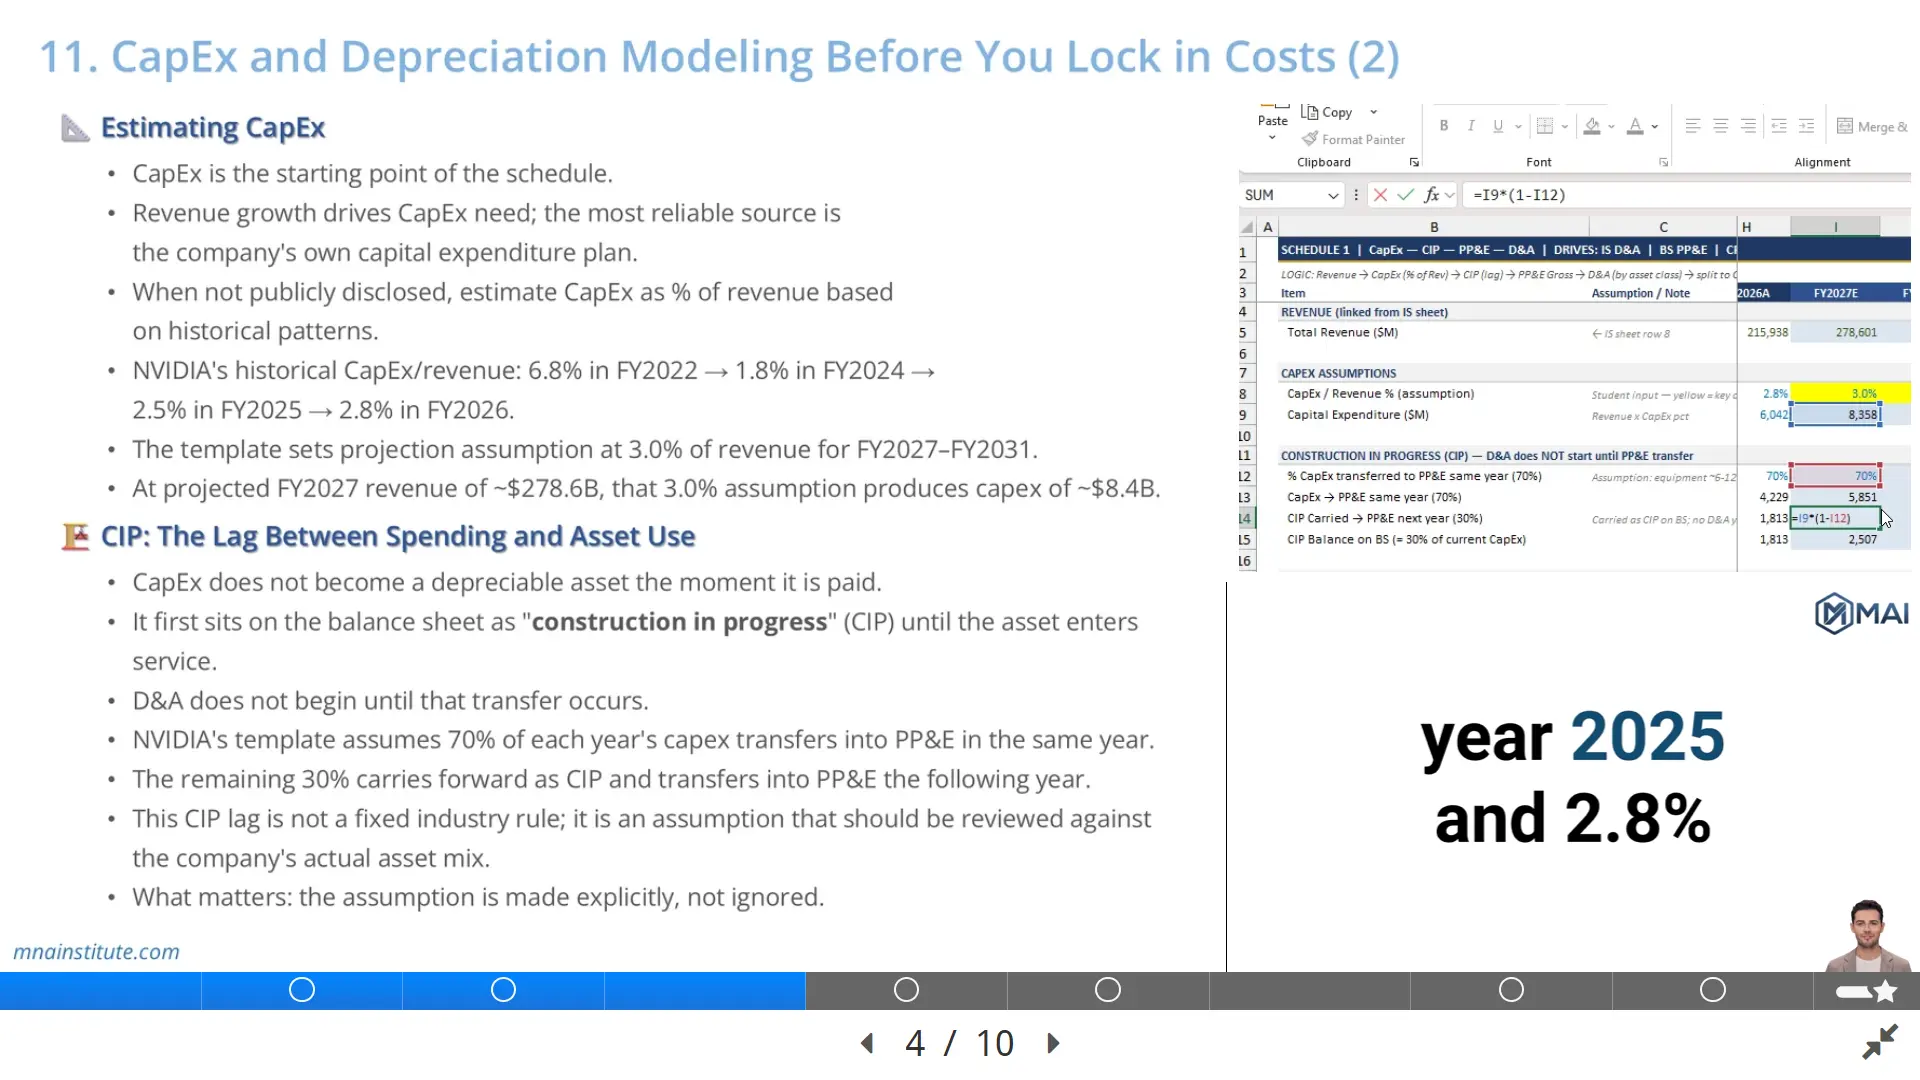
CapEx becomes tied to capacity or infrastructure needs.
Working capital becomes tied to revenue growth, inventory cycles, receivable days, and supplier terms.
D&A becomes tied to the asset base rather than an arbitrary percentage.
Debt and interest become tied to capital structure choices rather than a plug figure.
This is the analyst workflow behind the 3 statement model.

Step 2: Build the Schedules That Make the Model Work
Once revenue logic is defined, the model needs schedules that translate the business into financial statement mechanics.
This is where financial modeling in Excel becomes more than inputting lines into three statements.
A schedule is a controlled bridge between assumptions and statements.
CapEx and depreciation schedules explain how investment in assets affects both the balance sheet and the income statement.
Working capital schedules explain why growth can consume cash even when the income statement looks profitable.
Debt schedules explain how borrowing, repayments, and interest expense affect net income, cash flow, and leverage.
Share count schedules explain why net income alone is not enough for equity investors, because EPS depends on dilution, buybacks, stock-based compensation, and weighted average shares.
The key is that each schedule has a business reason.
A company with rising data center infrastructure needs may require higher CapEx before the revenue benefit is fully visible.
A business with longer customer payment terms may show strong revenue growth but weaker operating cash flow.
A company issuing shares or buying back stock may show different EPS even when net income is unchanged.
These links are why a 3 statement model produces insight that a simple revenue and margin forecast cannot provide.

Step 3: Complete the Three Statements from the Schedules
After the core schedules are built, the analyst can assemble the income statement, balance sheet, and cash flow statement.
The income statement begins with revenue and moves through cost of sales, gross profit, operating expenses, EBITDA, depreciation, EBIT, tax, net income, and EPS.
The balance sheet captures assets, liabilities, equity, retained earnings, debt, cash, working capital, and the accounting position created by business activity.
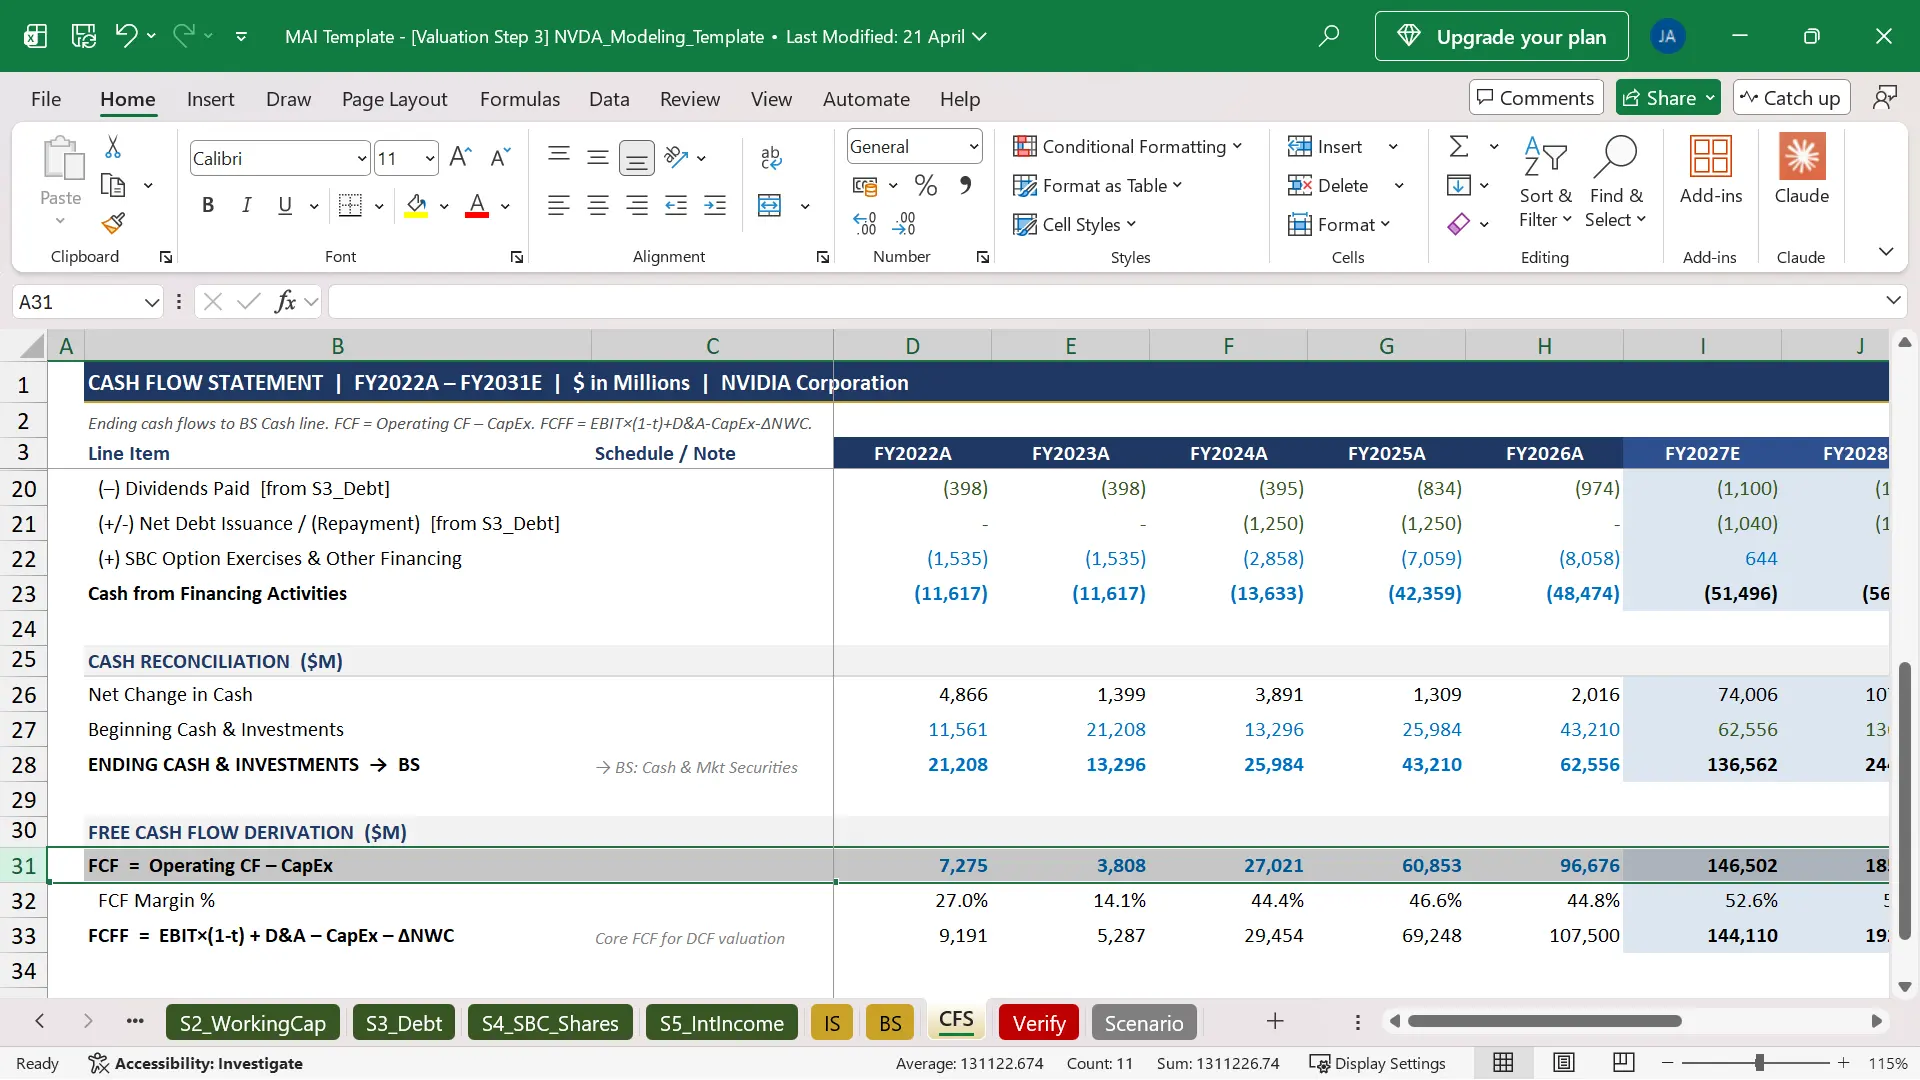
The cash flow statement reconciles net income to operating cash flow, investing cash flow, financing cash flow, and free cash flow.
A proper 3 statement model ties all three statements together.
Net income flows into retained earnings and the cash flow statement.
Depreciation reduces earnings but is added back in operating cash flow.
CapEx reduces cash and increases the asset base.
Working capital changes explain the difference between accounting profit and operating cash conversion.
Debt affects cash, interest expense, and leverage.
Share count affects EPS, which is one of the key outputs for equity research.
If the balance sheet does not balance or cash does not reconcile, the model is not complete.
This is why learning how to build a financial model requires more than memorizing the order of statements.
The analyst must understand how each line item behaves and how one assumption can move through the entire model.

Step 4: Produce EPS, EBITDA, and FCF Together
A 3 statement model is built for outputs that support decisions.
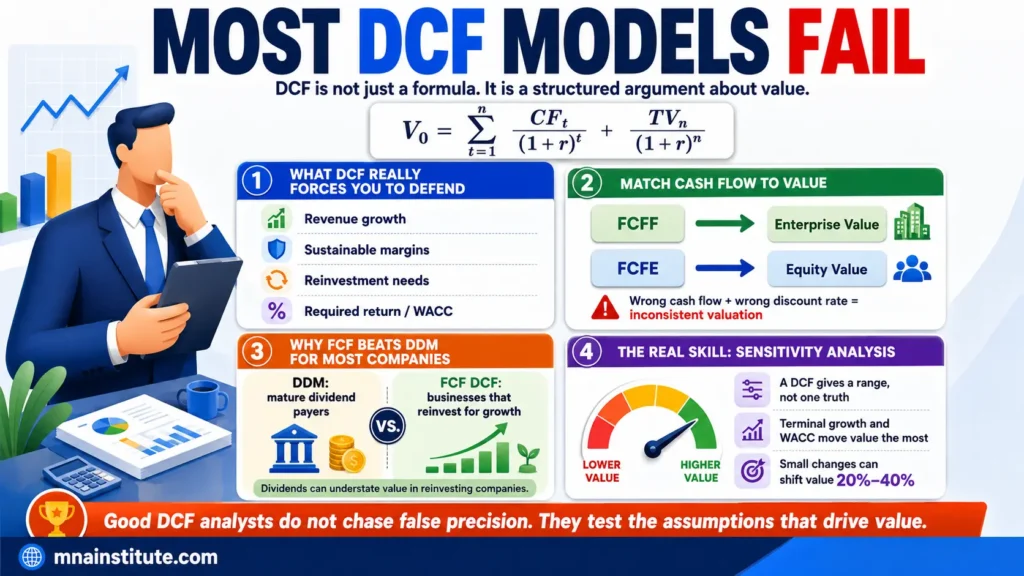
EPS, EBITDA, and FCF are not separate topics.
They are different views of the same modeled business.
EPS matters because equity analysts and investors often connect future earnings to price-to-earnings multiples and share price targets.
EBITDA matters because M&A, leveraged buyout, credit, and corporate finance teams often use EV to EBITDA multiples to value the operating business before financing decisions.
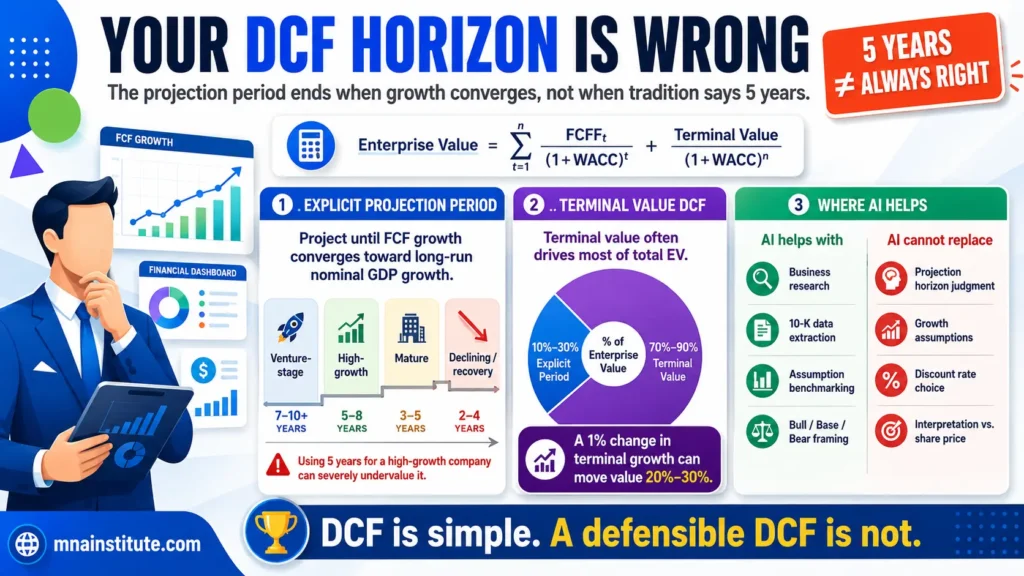
FCF matters because discounted cash flow analysis depends on cash that can be distributed or reinvested after operating needs and capital investment.
A model that produces only one of these outputs is incomplete for real investment work.
A company can show attractive EPS but weak cash conversion.
A company can show strong EBITDA but require heavy CapEx or working capital investment.
A company can generate high FCF but have low near-term EPS due to depreciation, tax, or non-cash charges.
The point is not to choose one metric and ignore the others.
The point is to understand what each metric says and what it leaves out.
That is why a three statement financial model is a better training ground than an isolated DCF template or a simple multiple table.
It forces the analyst to see the full financial story.

Step 5: Verify, Calibrate, and Stress-Test the Model
The most dangerous model is the one that appears polished but has not been verified.
A strong 3 statement model needs checks that confirm whether the mechanics are working.
The balance sheet must balance.
Cash must reconcile between the balance sheet and the cash flow statement.
Net income must connect correctly to retained earnings and operating cash flow.
CapEx must connect investing cash flow to PP&E.
D&A must connect the income statement, cash flow statement, and asset schedule.
Stock-based compensation must be handled consistently across earnings, cash flow, and share count.
These checks are not cosmetic.
They protect the analyst from presenting a forecast that has hidden mechanical errors.
CFA Institute notes that ratios and common-size statements can support comparison and analysis, but they indicate what happened rather than why it happened.
The same logic applies to models.
The spreadsheet output shows a result, but the analyst must still explain why the result is reasonable.
That requires verification, calibration, and stress testing.
A model should be compared against management guidance, consensus estimates, historical performance, margin structure, and business constraints before the forecast is finalized.
This is especially relevant when an analyst builds Bull, Base, and Bear cases for investment committee discussion.

Step 6: Use AI to Accelerate, Not Replace, Analyst Judgment
AI can improve the modeling workflow when it is used in the right places.
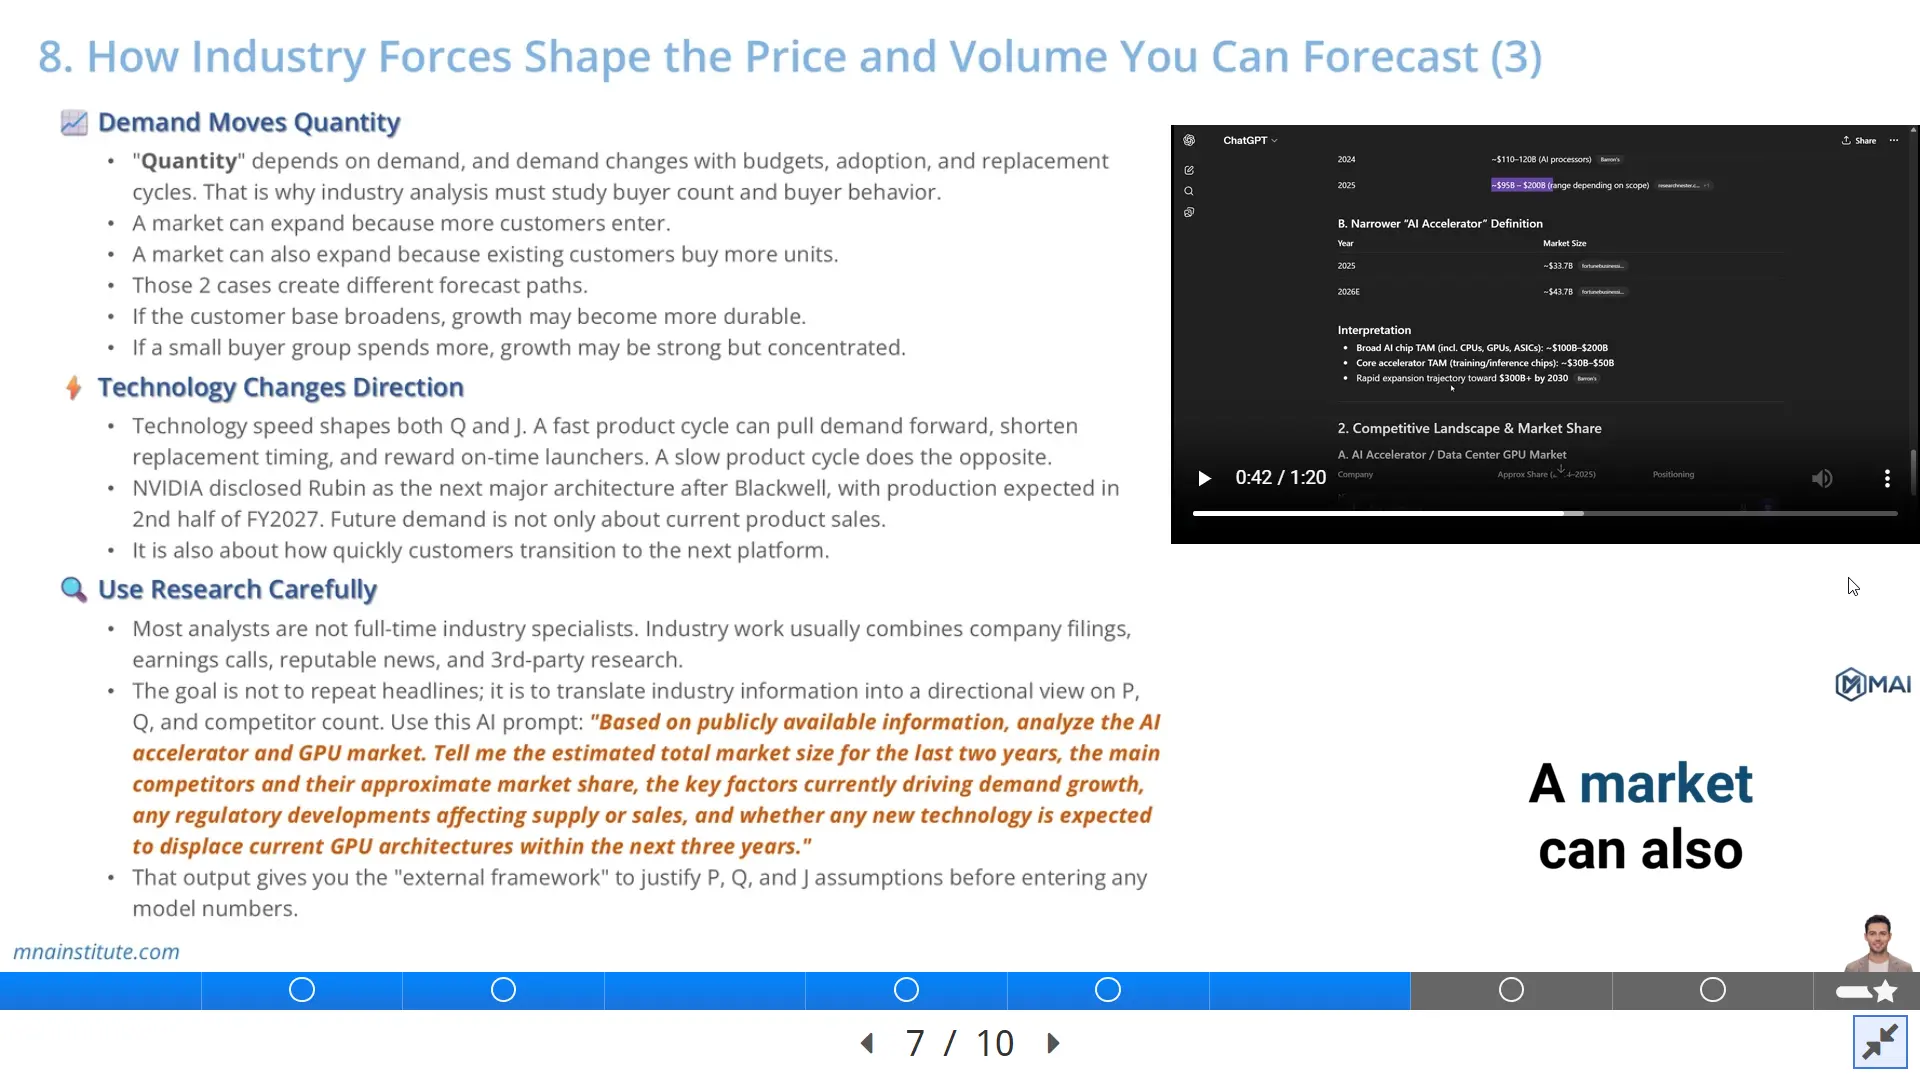
It can help extract filing data, summarize segment disclosures, organize revenue drivers, interpret management guidance, and draft first-pass commentary.
It can also help create checklists for financial model verification and highlight where assumptions may diverge from consensus or historical trends.
However, AI should not be treated as the analyst.
The analyst still owns the forecast logic, formula discipline, source verification, and investment conclusion.
In practice, AI is strongest when it accelerates repetitive work and weakest when it is asked to make judgment without evidence.
For example, AI can extract Alphabet segment data from a filing, but the analyst must decide whether Google Cloud growth should remain elevated or normalize.
AI can summarize NVIDIA risk factors, but the analyst must decide how those risks affect revenue, margins, CapEx, and working capital.
AI can help explain why a model output changed, but it cannot decide whether the output is investment-grade.
This is why AI-assisted financial modeling should be taught as a workflow of extraction, organization, verification, and interpretation.
The goal is not to let AI build an unverified model.
The goal is to help the analyst build a better 3 statement model faster while keeping judgment under human control.
Step 7: Connect the Model to Analyst Judgment
The comparison table at the start matters because financial modeling education often separates the exact skills that analysts use together.
One resource may teach formulas.
Another may teach shortcuts.
Another may provide a template without explaining why the assumptions work.
The analyst needs a joined-up workflow.
That workflow starts with business research, moves into a revenue forecasting model, builds schedules, completes the statements, verifies the outputs, calibrates the forecast, and converts the result into investment judgment.
A practical financial modeling course should train the analyst to defend each step.
If revenue is projected to grow faster than the market, the analyst should explain the product, customer, price, and volume logic.
If margins expand, the analyst should explain cost structure, operating leverage, mix, and scale.
If FCF improves, the analyst should explain cash conversion, CapEx intensity, and working capital discipline.
If EPS rises, the analyst should explain net income, tax, interest, dilution, and buyback assumptions.
This level of detail is what separates a spreadsheet user from a model-driven analyst.
A Practical Example: From Revenue Driver to Forecast Output
Consider a simplified semiconductor forecast.
The analyst starts with two product groups, one mature chip line and one new AI accelerator line.
The mature line grows slowly, but the AI accelerator line is growing from a smaller base with higher pricing power.
A weak model might enter a single 25% revenue growth assumption for the whole company.
A stronger model separates units, pricing, ramp timing, supply constraints, and customer adoption.
That revenue logic then drives gross margin, operating leverage, CapEx, D&A, working capital, share count, and FCF.
The result is not just a cleaner Excel file.
The result is a forecast that can be discussed with a portfolio manager, investment committee, corporate development team, or credit committee.
If reported revenue later exceeds the model, the analyst can identify whether the surprise came from volume, pricing, customer concentration, capacity, or mix.
That is the practical value of the 3 statement model.
It lets the analyst diagnose why the business moved, not only that the forecast was wrong.
What the 3 Statement Model Lets Analysts Decide
A completed 3 statement model should help the analyst answer questions that a static historical analysis cannot answer.
If revenue increases by 10%, the analyst should see what happens to gross profit, operating income, working capital, cash, debt capacity, EPS, EBITDA, and FCF.
If CapEx rises faster than revenue, the analyst should see whether free cash flow still supports the valuation case.
If customers pay more slowly, the analyst should see the pressure on operating cash flow even if the income statement still looks healthy.
If share count changes because of buybacks or stock-based compensation, the analyst should see how net income converts into EPS.
These questions are exactly why a 3 statement model is more powerful than a single-statement forecast.
The model lets the analyst test the financial consequence of a business assumption before the market confirms or rejects it.
In equity research, that means estimating whether a stock’s current price already reflects future earnings and cash flow.
In M&A, it means testing whether the target’s revenue, margin, and cash conversion support the transaction value.
In credit analysis, it means testing whether the company can service debt under Base, Bull, and Bear cases.
In corporate finance, it means testing whether a capital allocation plan can be funded without damaging liquidity or leverage.
A 3 statement model therefore becomes the shared language across finance teams.
The same file may be used differently, but the underlying discipline remains the same.
That discipline is the ability to connect business evidence to forecast assumptions and then connect those assumptions to complete financial statements.
Once that link is clear, financial modeling in Excel becomes a practical decision process rather than a formatting exercise.
This is also why the phrase how to build a financial model should not mean downloading a template and filling empty cells.
It should mean learning how business analysis becomes forecast logic, how forecast logic becomes schedules, and how schedules become statements that support analyst judgment.
A strong revenue forecasting model is the first major test of that process.
If the revenue logic is weak, the rest of the model may still calculate, but the conclusion will not be reliable.
If the revenue logic is strong, the three statement financial model has a much better chance of producing a defensible EPS and FCF view.
Why the Same Model Serves Different Finance Decisions
The best way to learn how to build a financial model is to build one from the business upward.
That means reading the 10-K, extracting the relevant business drivers, building a revenue forecasting model, constructing the schedules, completing the statements, and verifying the outputs.
It also means knowing why sell-side, buy-side, M&A, credit, and corporate finance teams may use the same model differently.
A sell-side banker may use the model to support a financing, IPO, debt issuance, or M&A transaction.
A buy-side analyst may use the same model to decide whether the market price reflects future earnings and cash flow.
A corporate finance team may use the model to evaluate capital allocation, budget scenarios, or strategic investment.
The mechanics are similar, but the decision context changes.
That is why the model must be both technically correct and analytically defensible.
Related Courses from M&A Institute
The 3 statement model becomes more useful when it sits inside a broader valuation and transaction workflow.
These related learning paths connect financial modeling to financial statement analysis, investment valuation, M&A, due diligence, and integration work.
- Financial Modeling and Valuation Course with AI and Excel connects the 3 statement model to WACC, DCF, comparable company analysis, and a professional valuation report.
- Financial Statement Analysis Course with AI for Equity Research builds the accounting and 10-K analysis foundation required before forecasting.
- 3-Statement Financial Modeling Course with AI focuses directly on building revenue, schedules, statements, EPS, EBITDA, FCF, verification, and scenarios.
- Mergers and Acquisitions Online Course applies model outputs to deal screening, valuation, negotiation, and integration judgment.
- M&A Due Diligence Course uses financial analysis and model outputs to test commercial, financial, legal, and HR risks.
- Post Merger Integration Course connects modeled value creation to execution, synergy tracking, and value-up planning after closing.
Sources
The following sources were used to support the discussion of 10-K reading, financial analysis techniques, and public company filing review.
- SEC Investor Bulletin: How to Read a 10-K
- SEC Investor.gov: Form 10-K overview
- CFA Institute: Financial Analysis Techniques
- Microsoft Investor Relations: SEC filings