Three Financial Statements: 1 Business, 3 Questions
A junior analyst can open an annual report and still miss the business if each statement is read in isolation.
Revenue may be growing, but receivables may be rising faster than cash collections.
Net income may look strong, but operating cash flow may tell a more cautious story.
Assets may be expanding, but the balance sheet may show that growth is funded by debt, payables, or retained earnings.
This is why the three financial statements must be read together rather than memorized as separate accounting documents.
The income statement, balance sheet, and cash flow statement answer different questions about one business.
The point of analysis is to connect those questions into one view of performance, position, and cash conversion.

How the Three Statements Divide the Business Story
|
Statement |
Main question |
Time basis |
Analyst focus |
|
Income statement |
Did the company make money? |
Period |
Revenue, margins, expenses, net income |
|
Balance sheet |
What does the company own and owe? |
Point in time |
Assets, liabilities, equity, liquidity, capital structure |
|
Cash flow statement |
Where did the actual cash go? |
Period |
Operating cash flow, CapEx, financing, dividends |

Three Financial Statements, One Business Question
The phrase three financial statements refers to the income statement, the balance sheet, and the cash flow statement.
Each document is built for a different analytical purpose.
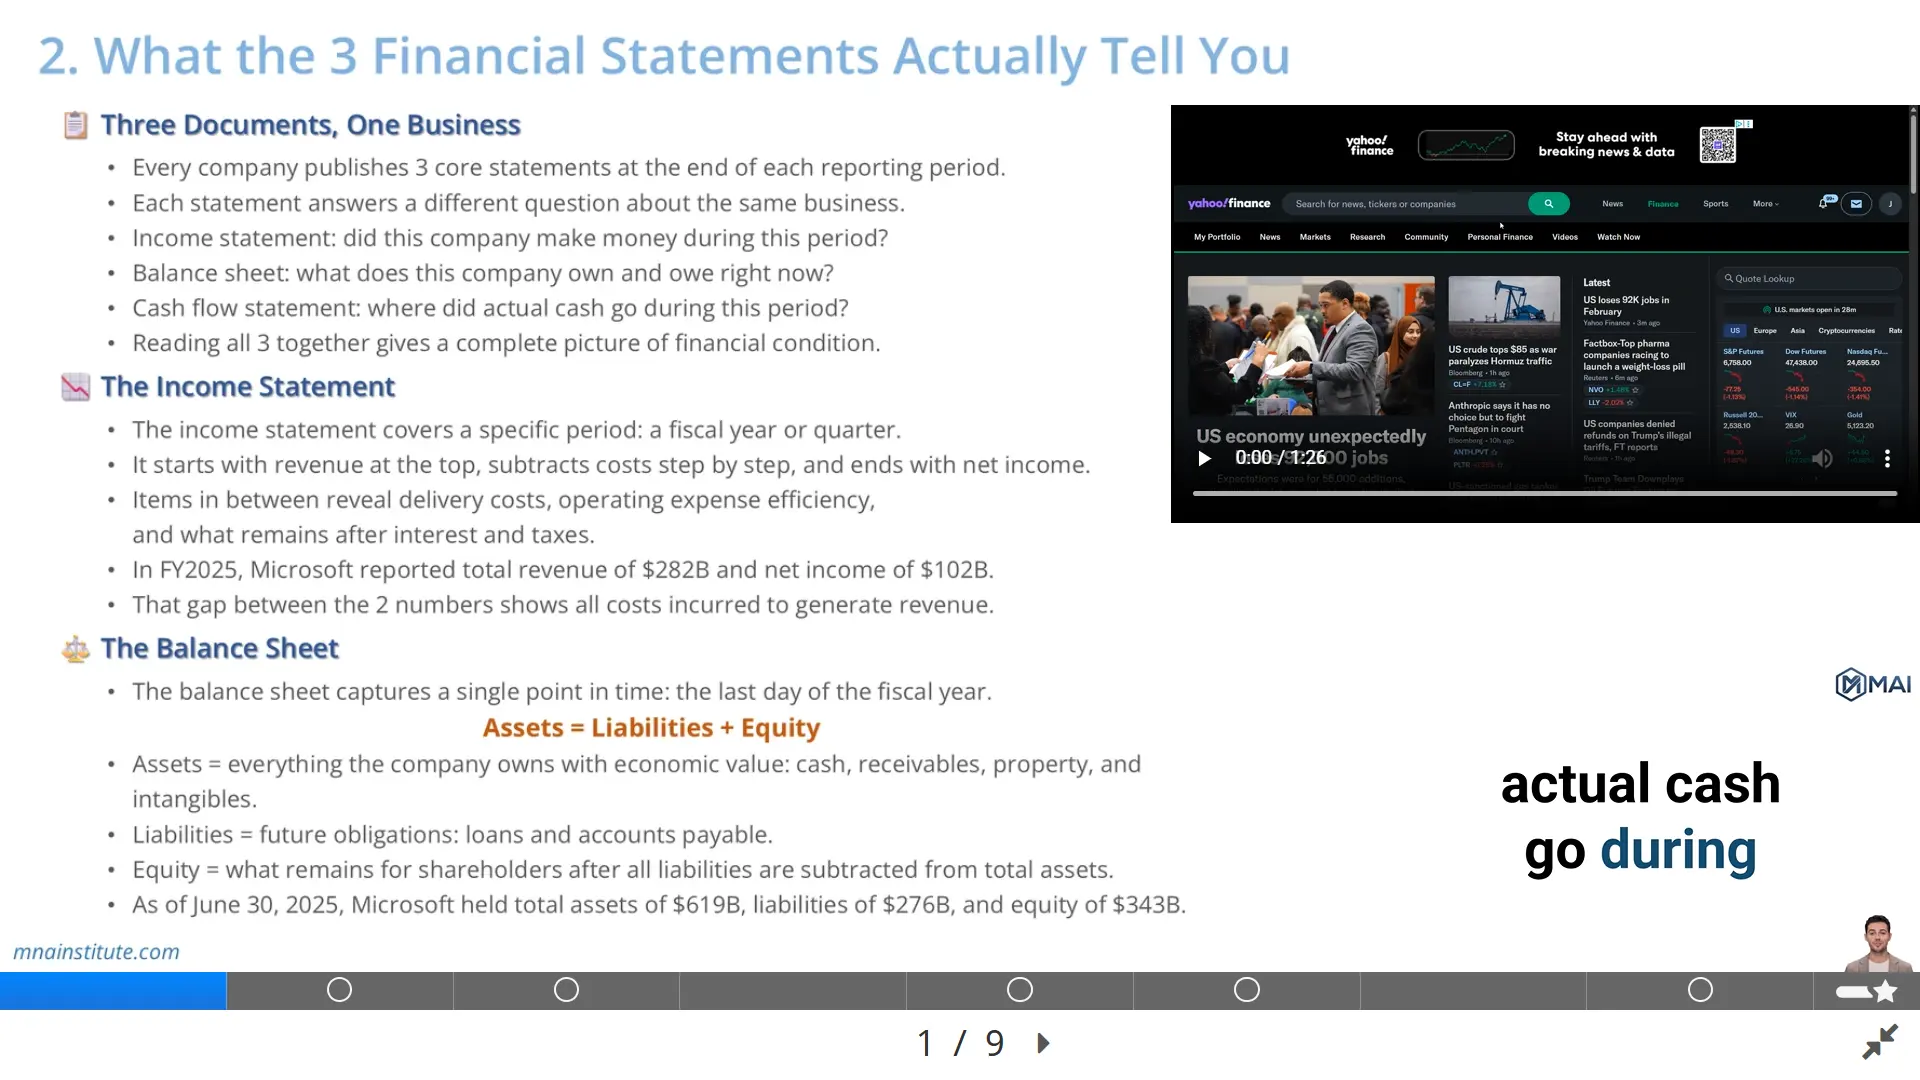
The income statement explains performance across a reporting period.
The balance sheet explains financial position at one point in time.
The cash flow statement explains how actual cash moved during the same period as the income statement.
A complete analyst does not ask which statement is the most important.
The better question is what each statement is capable of proving and what it cannot prove alone.
The SEC describes balance sheets as showing what a company owns and owes at a fixed point in time, income statements as showing money made and spent over a period, and cash flow statements as showing money exchanged with the outside world over a period.
That distinction is the starting point for how to read financial statements in practice.
The income statement may tell you that a business is profitable.
The balance sheet may tell you whether the business has enough liquidity and capital support.
The cash flow statement may tell you whether profit is turning into cash that can fund growth, dividends, debt repayment, or acquisitions.
When the three financial statements point in the same direction, the business story becomes easier to defend.
When they point in different directions, the analyst has to investigate the gap rather than accept the headline profit number.
This is the reason three financial statements are the foundation of practical financial analysis rather than a beginner accounting topic.
They provide the evidence used later in ratio analysis, financial modeling, valuation, credit review, and M&A diligence.
Income Statement: Performance Over a Period
The income statement covers a specific period, such as a quarter or a fiscal year.
It begins with revenue and moves downward through the cost structure until it reaches net income.
That layout is not just an accounting convention.
It shows how much value the company captured from customers and how much of that value was consumed by product costs, operating expenses, interest, taxes, and other items.
For an analyst, revenue is not simply the top line.
Revenue is the first signal of demand, pricing power, customer activity, product adoption, and market position.
Gross profit shows how much revenue remains after direct production or service delivery costs.
Operating income shows whether the core business can cover research, selling, marketing, administration, and other operating costs.
Net income shows what remains after the full accounting income statement has included interest, taxes, and other non-operating effects.
Microsoft provides a useful real-world example because its FY2025 income statement shows both enormous scale and high profitability.
Microsoft reported revenue of about $281.7B and net income of about $101.8B for fiscal year 2025.
The gap between revenue and net income is where the analyst studies cost of revenue, operating expenses, tax, and the economics of the business model.
A beginner may stop at whether net income rose or fell.
A stronger analyst asks which line items caused the movement and whether those drivers are likely to continue.
This is where financial statements explained only through definitions become inadequate.
The income statement is not a list of accounting lines.
It is a period-based map of the company’s operating economics.
When the income statement is read inside the three financial statements framework, each margin becomes a question about business quality.
A high margin company may still require balance sheet and cash flow review before the analyst concludes that the earnings are durable.

Balance Sheet: Financial Position at One Date
The balance sheet captures a single date rather than a full period.
Its core equation is simple and should always be written as a formula.
Assets = Liabilities + Equity
Assets are resources controlled by the company that have economic value.
Liabilities are claims that creditors, suppliers, employees, governments, or other parties have against the company.
Equity is the residual claim left for shareholders after liabilities are deducted from assets.
The balance sheet answers a different question from the income statement.
It does not ask whether the company made money during the year.
It asks what the company owns, what it owes, and how much residual capital belongs to shareholders at the reporting date.
Microsoft’s FY2025 balance sheet gives a direct example.
As of June 30, 2025, Microsoft reported total assets of about $619B, total liabilities of about $276B, and stockholders’ equity of about $343B.
Those numbers do not tell the whole story by themselves.
An analyst still needs to understand what type of assets are held, how much cash is available, how much debt exists, and whether liabilities are operational or financial.
A balance sheet can also reveal risks that the income statement hides.
A company may show strong profits while receivables grow too quickly, inventory accumulates, debt rises, or cash falls.
That is why the balance sheet is the second lens in how to read financial statements.
It checks whether the performance shown in the income statement is supported by a stable financial position.
This is why the balance sheet should never be treated as a static accounting schedule.
Inside the three financial statements, it is the statement that shows whether growth has created financial strength or merely expanded the size of the company.

Cash Flow Statement: Where Cash Actually Moved
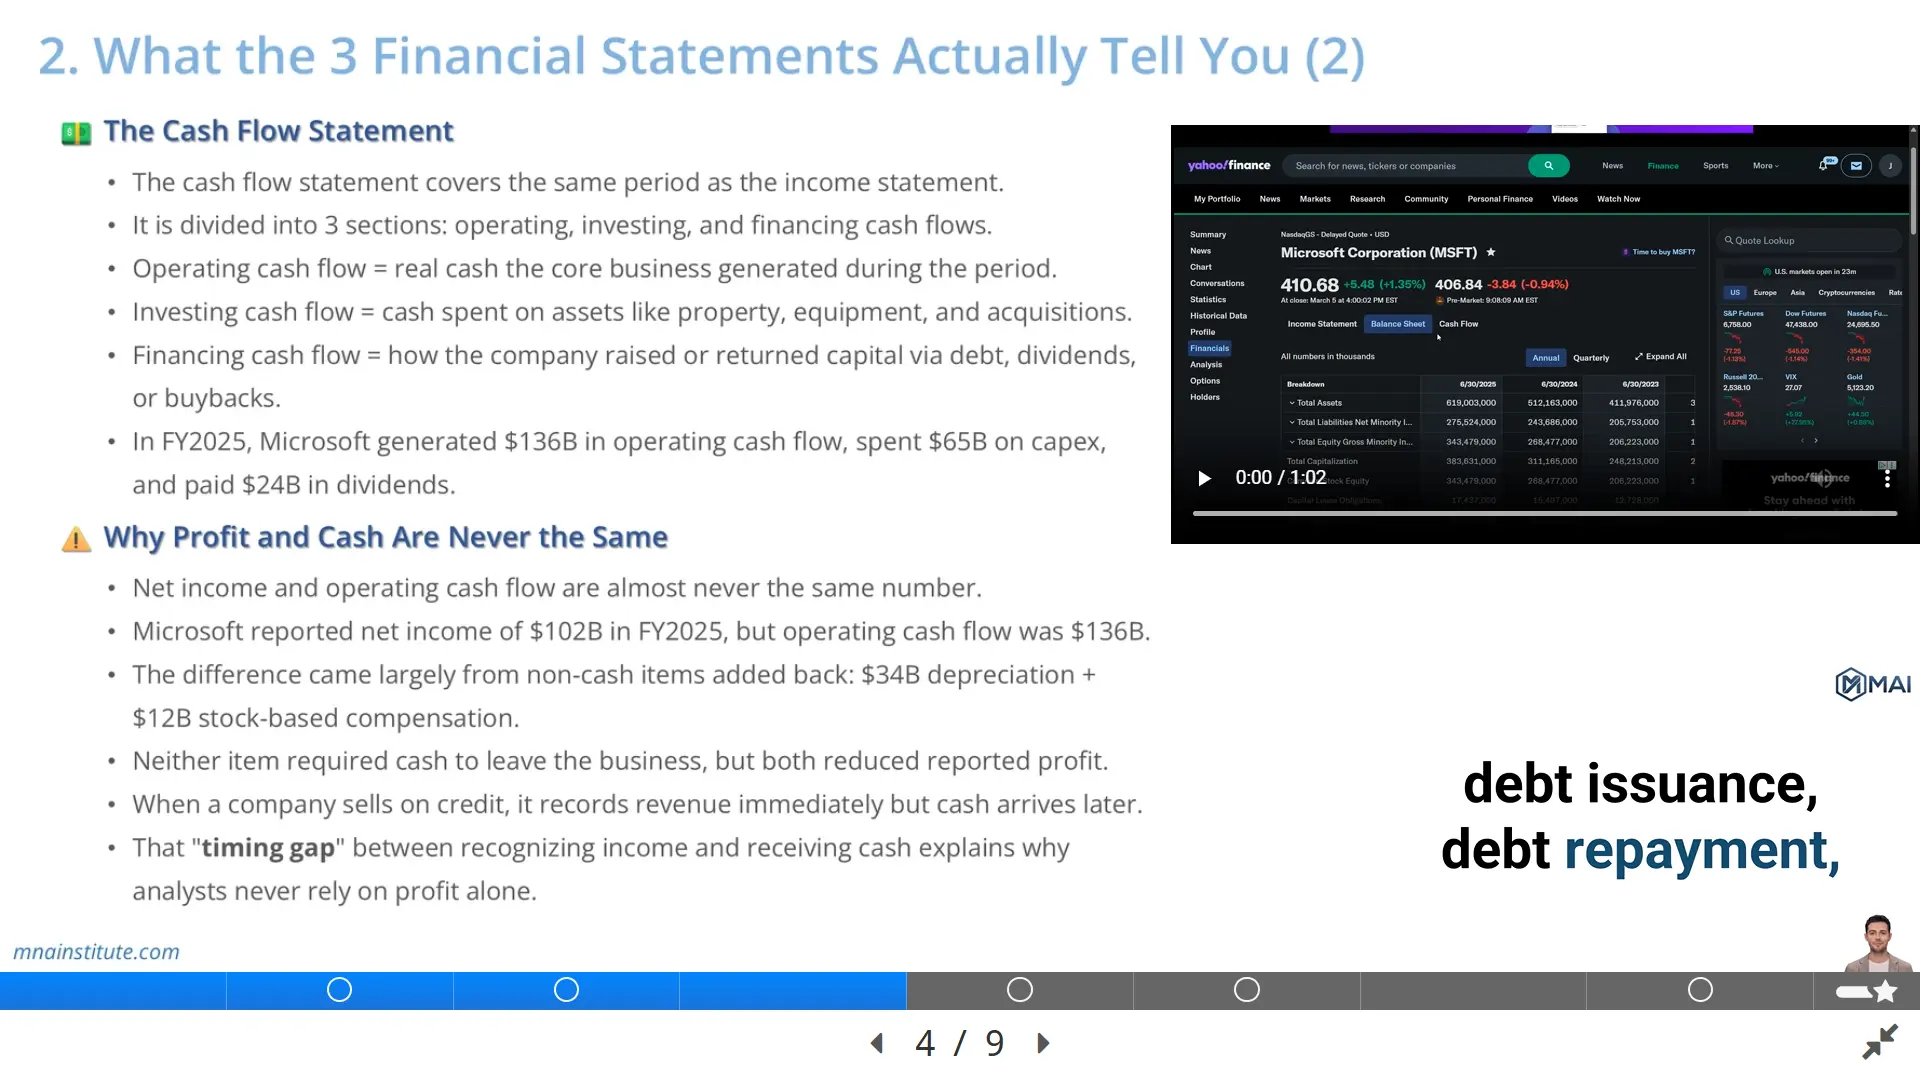
The cash flow statement covers a period, just like the income statement.
Its job is different because it focuses on cash received and cash paid rather than accounting profit.
The cash flow statement is usually divided into three sections.
Operating cash flow shows cash generated or consumed by the core business.
Investing cash flow shows cash used for long-term assets, acquisitions, securities, or proceeds from asset sales.
Financing cash flow shows cash raised from or returned to capital providers through debt, equity, dividends, and buybacks.
CFA Institute explains that the statement of cash flows provides information about cash receipts and payments during an accounting period and reconciles cash accounts between balance sheet dates.
That reconciliation role is why the cash flow statement is a control document as well as an analytical document.
It connects accounting performance to liquidity.
Microsoft again provides a useful example.
In fiscal year 2025, Microsoft generated about $136B in operating cash flow, spent about $65B on additions to property and equipment, and paid about $24B in dividends.
Those numbers show that the business produced substantial operating cash, reinvested heavily, and still returned capital to shareholders.
That interpretation cannot be reached from the income statement alone.
The cash flow statement shows whether profits are financially usable.
It also shows whether growth is consuming cash, whether capital expenditure is rising, and whether shareholder returns are funded by operations or by financing activity.
For valuation, credit analysis, and M&A due diligence, this is where accounting performance becomes cash reality.
A valuation model that ignores cash flow quality can overstate the value of a profitable company that cannot collect cash or must reinvest heavily to stay competitive.
That is why three financial statements analysis always returns to the cash flow statement before reaching a conclusion.

Why Net Income and Cash Flow Are Never the Same
One of the most useful lessons in the three financial statements is that profit and cash are not the same.
Net income is measured under accrual accounting.
That means revenue can be recognized before cash is collected, and expenses can be recognized before or after cash actually leaves the company.
Operating cash flow starts with net income and adjusts for non-cash items and working capital movements.
This is why two companies with the same net income can have very different cash flow quality.
Microsoft’s FY2025 figures illustrate the point.
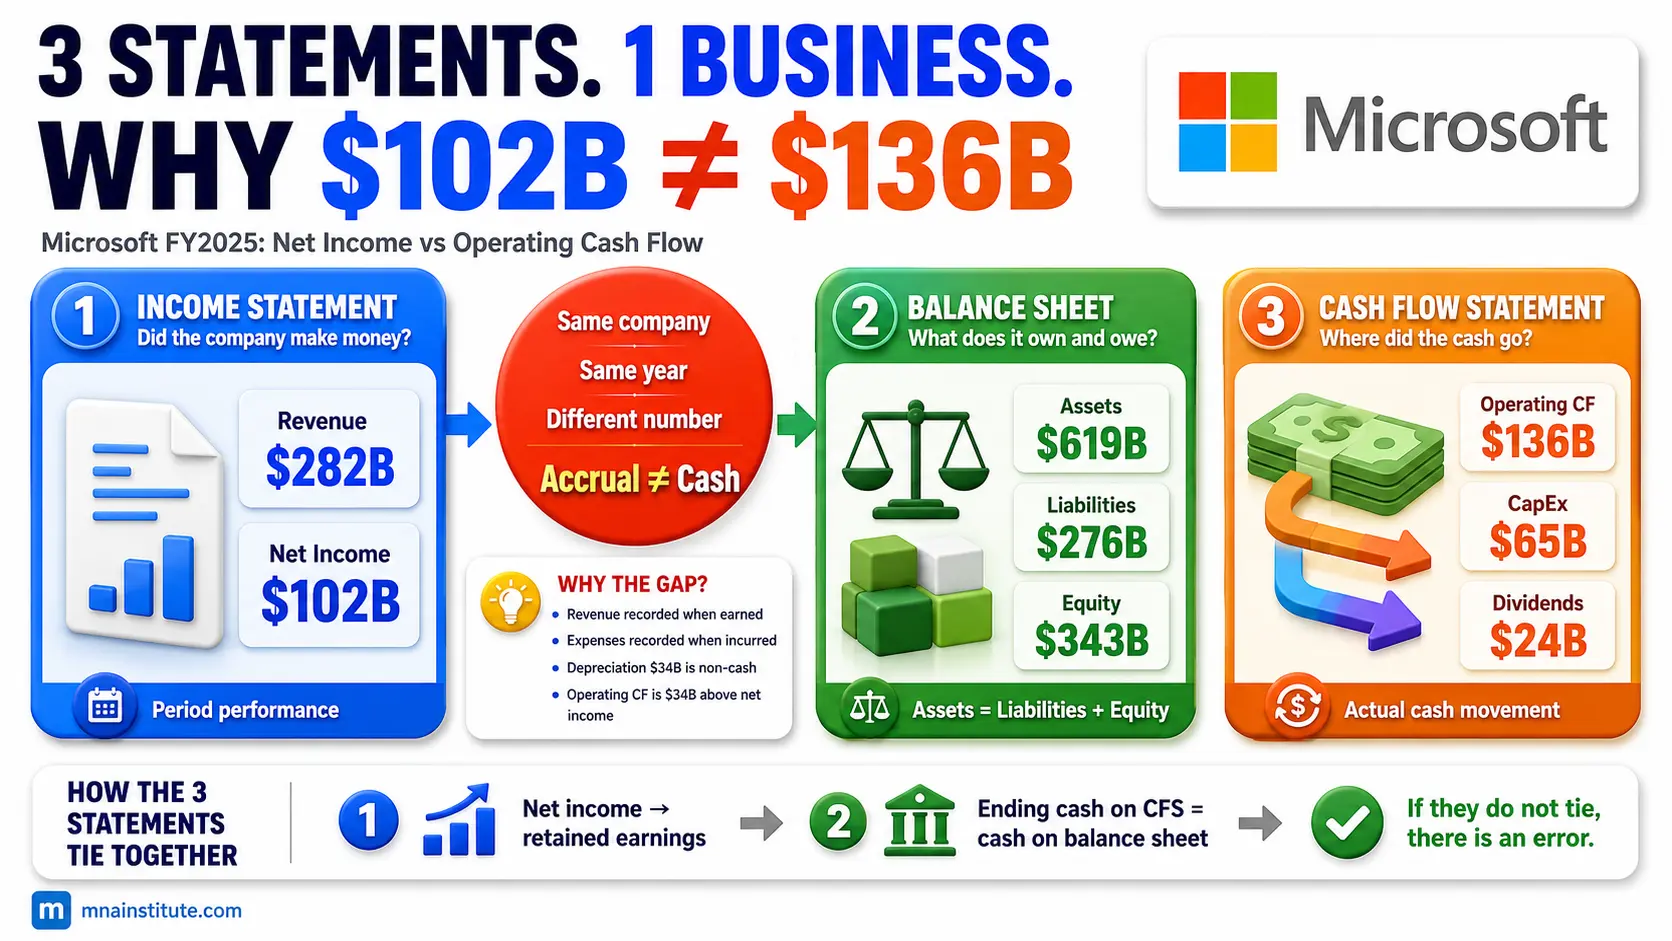
Microsoft reported net income of about $102B, while operating cash flow was about $136B.
Part of that gap came from non-cash charges such as depreciation, amortization, and stock-based compensation.
Those items reduce accounting profit but do not require cash to leave the company in the same period.
Working capital can also create a gap between profit and cash.
When a company sells to customers on credit, it records revenue before cash arrives.
When receivables rise faster than sales, the income statement may look stronger than the cash collection pattern.
When inventory rises, cash may be tied up before revenue is recognized.
When payables rise, a company may temporarily conserve cash by paying suppliers later.
This is why cash flow vs net income is not a minor accounting topic.
It is a central question in earnings quality.
A company that reports profits without converting them into operating cash deserves closer investigation.
A company that produces strong operating cash flow while also investing heavily may be funding growth from internal cash generation.
The cleanest way to explain this to a new analyst is simple.
Net income is an accounting result, while cash flow is the movement of cash through the business.
The three financial statements show both numbers and force the analyst to reconcile them.

How the Three Statements Connect
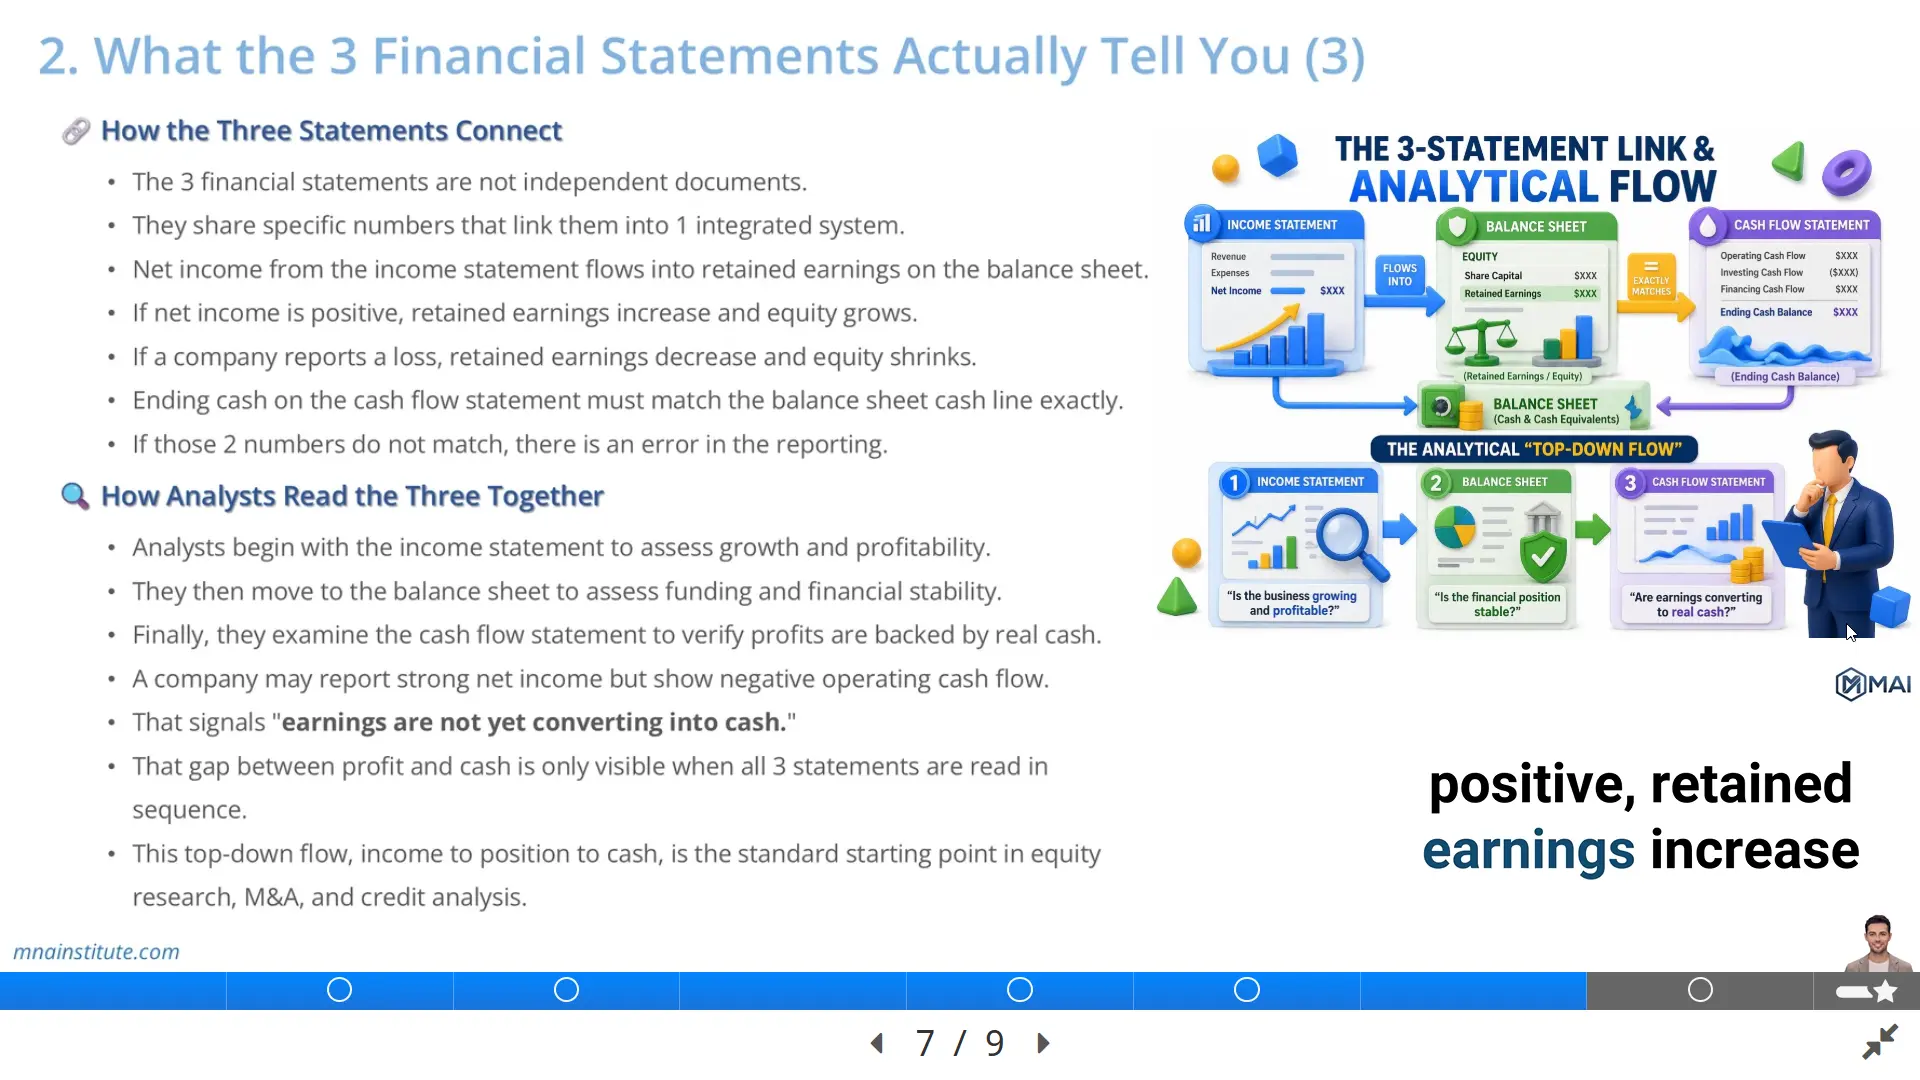
The three financial statements are not separate reports placed beside each other.
They are connected through specific linkages that make the financial model internally consistent.
The most visible linkage starts with net income.
Net income from the income statement flows into retained earnings on the balance sheet after dividends are deducted.
A simplified retained earnings bridge can be written as follows.
Ending Retained Earnings = Beginning Retained Earnings + Net Income – Dividends
The second major linkage is cash.
The ending cash balance on the cash flow statement must match the cash and cash equivalents line on the balance sheet.
If it does not match, the model or the analysis is broken.
The third linkage is the balance sheet equation.
Assets = Liabilities + Equity
If assets do not equal liabilities plus equity, the statement does not balance.
The fourth linkage involves working capital.
Changes in receivables, inventory, payables, accrued expenses, and other operating balances affect operating cash flow.
That is why the balance sheet explains part of the difference between net income and cash flow.
The fifth linkage involves long-term assets.
Capital expenditure appears in investing cash flow, increases property and equipment on the balance sheet, and later creates depreciation expense on the income statement.
This connection is the foundation of a three-statement model.
An analyst who understands these linkages can move from reported statements to forecast models, valuation assumptions, and diligence questions.
This is also why a three statement financial model must balance before its valuation output is trusted.
The three financial statements create the logic that later controls forecast revenue, working capital, capital expenditure, depreciation, cash, debt, and equity.

Microsoft FY2025 Example: Reading the Three Together
The practical value of the three financial statements becomes clearer when one company is read through all three lenses.
Microsoft’s FY2025 reporting provides a clean example because the company combines high profitability, substantial reinvestment, and strong cash generation.
Start with the income statement.
Revenue of about $281.7B and net income of about $101.8B show scale and profitability.
That tells us the business generated a large accounting surplus after costs, operating expenses, taxes, and other items.
Move next to the balance sheet.
Total assets of about $619B, total liabilities of about $276B, and equity of about $343B show the company’s financial position at year end.
The balance sheet lets the analyst ask whether the company has the liquidity, asset base, and capital structure to support the business shown on the income statement.
Finally, read the cash flow statement.
Operating cash flow of about $136B shows that reported earnings converted into even higher operating cash during the year.
Capital expenditure of about $65B shows substantial reinvestment, which matters for cloud, AI infrastructure, and long-term capacity.
Dividends of about $24B show capital returned to shareholders.
The story is not simply that Microsoft was profitable.
The more complete story is that Microsoft generated high earnings, converted those earnings into operating cash, reinvested heavily, and still returned capital.
That is the difference between reading one statement and reading a business.
This example also shows why income statement balance sheet cash flow analysis should be sequential.
Performance, position, and cash movement explain different parts of the same company.
The Microsoft example also shows that large companies cannot be understood from the income statement alone.
The three financial statements make the analyst test whether scale, profitability, reinvestment, and cash return can coexist in one coherent story.
Analyst Workflow: From Statements to Valuation Judgment
Professional analysts usually follow a top-down workflow when they read the three financial statements.
They begin with the income statement to understand growth, margins, operating leverage, and profitability.
They then move to the balance sheet to understand liquidity, leverage, working capital, asset intensity, and shareholder capital.
They finish with the cash flow statement to test whether profit turns into cash and whether the company can fund its own growth.
This workflow is used in equity research, M&A due diligence, credit analysis, corporate finance, and valuation.
In equity research, the analyst wants to know whether future earnings can support a target price.
In M&A due diligence, the buyer wants to know whether reported performance is durable, cash-backed, and free from obvious financial red flags.
In credit analysis, the lender wants to know whether cash flow can service debt.
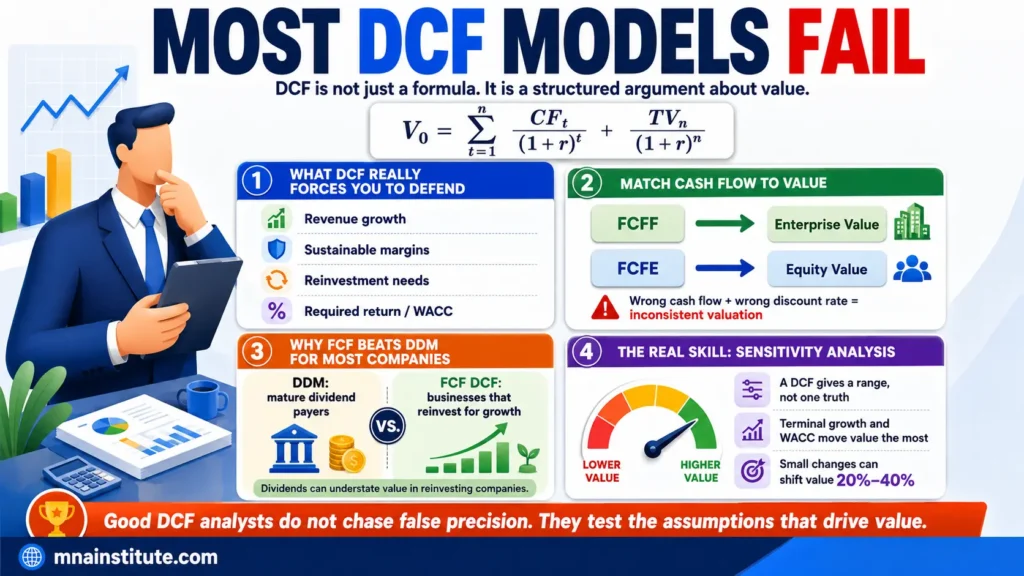
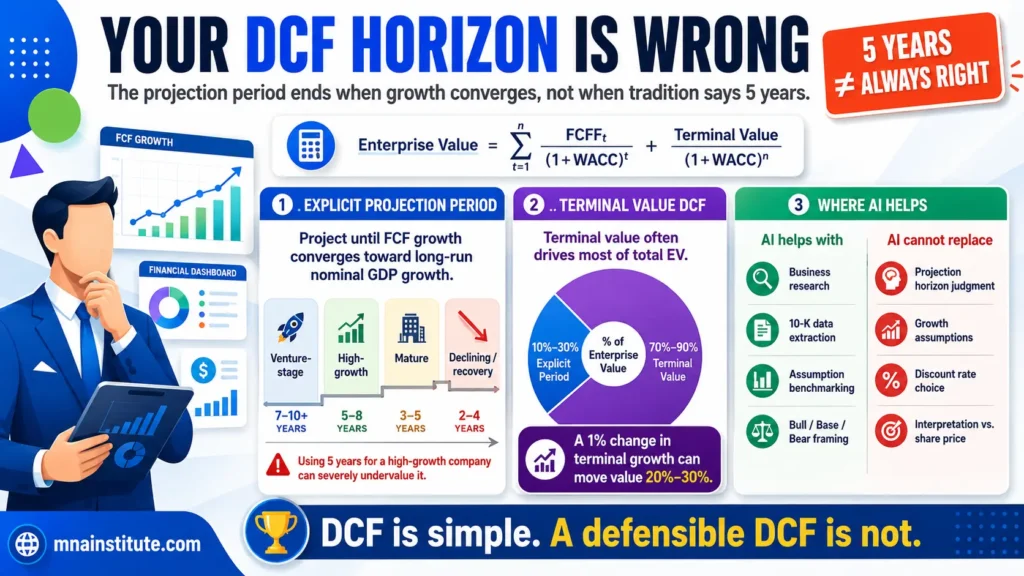
In valuation, the analyst needs reliable historical inputs before building forecasts, free cash flow, WACC, DCF, CCA, and valuation conclusions.
The three financial statements are the raw material for all of those workflows.
A beginner may read the statements to define line items.
A working analyst reads the statements to form questions.
- Why did revenue grow faster than cash collections.
- Why did operating cash flow exceed net income.
- Why did capital expenditure rise.
- Why did liabilities increase.
- Why did equity change.
Those questions are where financial analysis begins.
The goal is not to memorize statements.
The goal is to use them to judge whether the company’s performance, position, and cash conversion support the business story management is telling.
When learners understand this workflow, the three financial statements stop being exam material and become the first screen for investment judgment.
That is the standard expected before moving into forecasting, DCF, comparable company analysis, or deal due diligence.
Analyst Reading Checklist
- Start with revenue growth, margin movement, and net income quality.
- Check whether assets, liabilities, and equity support or contradict the performance story.
- Use operating cash flow to test whether profit is converting into usable cash.
- Reconcile ending cash to the balance sheet before trusting the model.
- Investigate any gap between net income and operating cash flow before making a valuation conclusion.
Related Courses
Financial statement reading becomes more useful when it connects to modeling, valuation, and deal judgment.
- The Financial Modeling and Valuation Course with AI and Excel links statement analysis to 3-statement modeling, WACC, DCF, CCA, sensitivity, and valuation report writing.
- The Financial Statement Analysis Course with AI for Equity Research focuses more directly on 10-K reading, ratio work, earnings quality, financial red flags, and AI-assisted financial analysis.
- The 3-Statement Financial Modeling Course with AI turns historical statement reading into forecast logic, EPS, EBITDA, and FCF outputs.
- For M&A workflows, the Mergers and Acquisitions Online Course and M&A Due Diligence Course connect financial statement interpretation to target screening, risk review, and transaction judgment.
Sources
- SEC – Beginners Guide to Financial Statements
- Microsoft 2025 Annual Report
- CFA Institute – Introduction to Financial Statement Analysis
- CFA Institute – Analyzing Statements of Cash Flows I